WASHINGTON, D.C. -- Gallup's U.S. Economic Confidence Index remained at -17 in the first week of September, the same score as in the last week of August. For the sixth week in a row, index readings have not strayed from a narrow range of -15 to -17.
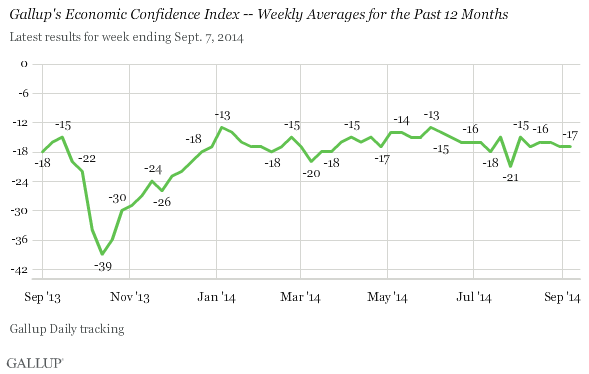
After the index took a tumble in late July, dropping briefly to -21 -- the lowest weekly reading it has seen in 2014 so far -- it recovered quickly, climbing to -15 in the week ending Aug. 3, and has held near that level since. For the year to date, the weekly index has averaged -16.
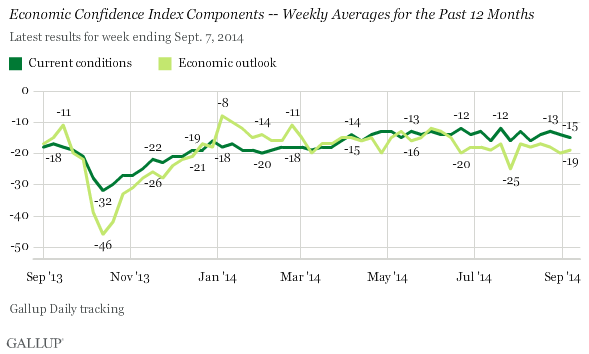
Gallup's Economic Confidence Index is the average of two components: Americans' views of the current economic situation and their perceptions about whether the economy is getting better or getting worse. The theoretical maximum score is +100, if all Americans believe the economy is "excellent" or "good" and "getting better." The theoretical minimum score is -100, if all Americans say the economy is "poor" and "getting worse."
Americans continue to be slightly more positive about current economic conditions than about the direction the economy is heading in. For the week ending Sept. 7, one in five Americans (20%) rated the economy excellent (2%) or good (18%), while 35% said it was poor. This resulted in a current conditions score of -15, just one point lower than the previous week. Meanwhile, 37% of Americans said the economy was getting better while 56% said it was getting worse, resulting in an economic outlook score of -19 -- up a point from the week before.
Bottom Line
So far, 2014 has been a unique year for the U.S. Economic Confidence Index in that it has been remarkably steady throughout the winter, spring, and summer. In previous years, the weekly index readings from January through August had high-to-low ranges of 17 to 36 index points. In 2014, the index has stayed within a narrower eight-point range.
However, the index remains in negative territory. And though it has been stable, it can also be viewed as stagnant, because it has registered no real improvements in economic confidence despite significant gains in Americans' perceptions of job creation and consumer spending.
It's hard to predict the direction of an index that has barely moved over the past eight months. But with Labor Day marking the unofficial end of summer, the index's behavior in September could be indicative of how it will perform for the rest of the year.
Survey Methods
Results for this Gallup poll are based on telephone interviews conducted Sept. 1-7, 2014, on the Gallup Daily tracking survey, with a random sample of 3,021 adults, aged 18 and older, living in all 50 U.S. states and the District of Columbia.
For results based on the total sample of national adults, the margin of sampling error is ±2 percentage points at the 95% confidence level.
Interviews are conducted with respondents on landline telephones and cellular phones, with interviews conducted in Spanish for respondents who are primarily Spanish-speaking. Each sample of national adults includes a minimum quota of 50% cellphone respondents and 50% landline respondents, with additional minimum quotas by time zone within region. Landline and cellular telephone numbers are selected using random-digit-dial methods. Landline respondents are chosen at random within each household on the basis of which member had the most recent birthday.
Samples are weighted to correct for unequal selection probability, nonresponse, and double coverage of landline and cell users in the two sampling frames. They are also weighted to match the national demographics of gender, age, race, Hispanic ethnicity, education, region, population density, and phone status (cellphone only/landline only/both, and cellphone mostly). Demographic weighting targets are based on the most recent Current Population Survey figures for the aged 18 and older U.S. population. Phone status targets are based on the most recent National Health Interview Survey. Population density targets are based on the most recent U.S. census. All reported margins of sampling error include the computed design effects for weighting.
In addition to sampling error, question wording and practical difficulties in conducting surveys can introduce error or bias into the findings of public opinion polls.
For more details on Gallup's polling methodology, visit www.gallup.com.
