PRINCETON, NJ -- It is not the worst of times, but it is far from the best of times when it comes to Americans' perceptions on how things are going in the country. Just shy of one in four Americans, 23%, are currently satisfied with the direction of the country, while 76% are dissatisfied. This marks the 10th consecutive month that satisfaction has fallen between 23% and 25% -- a remarkably narrow range in a measure that has reached as high as 70% and as low as 7% since 2000.
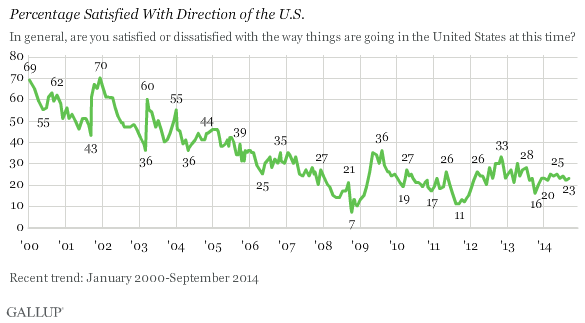
The latest results are from the 2014 Gallup Poll Social Series: Governance survey, conducted Sept. 4-7.
This month's rating also matches the average so far in 2014, which is down slightly from an average 24% in 2013, but up from 17% in 2011. The main difference between satisfaction in 2014 and those prior years is the stability seen this year.
From a longer-term perspective, however, Americans' satisfaction with the way things are going has been relatively stable over the past four years -- since 2010 -- despite some short-term changes, most evident in the election year of 2012. It was somewhat higher in 2009, shortly after President Barack Obama first took office, and was significantly lower in 2008 during the Wall Street financial crisis and as the effects of the 2007-2009 recession were taking hold. And, of course, it was significantly higher in the first part of the last decade, including reaching 70% after the 9/11 attacks when Americans felt a surge of patriotism.
Satisfaction has also been steady among the major party groups, with Democrats consistently a bit more satisfied than independents, and Republicans the least satisfied. Current satisfaction is 36% among Democrats, 22% among independents, and 9% among Republicans. This reflects the historical pattern by which Americans who identify with the party of the president are more satisfied than those in the opposing party. That is about as much variation as Gallup sees in satisfaction among U.S. subgroups. The only demographic group that shows a higher satisfaction rating is nonwhites, at 40%. The only group that comes close to the low satisfaction among Republicans is whites, at 16%.
Nearly Half Are Very Dissatisfied
In addition to Americans' extreme tilt toward a negative view of the country today, nearly half of the public say they are very dissatisfied with the way things are going. That is slightly worse than in January when 42% were highly dissatisfied -- at a time when overall satisfaction matched today's level. Thus, the public's mood is worse today by this measure. However, it is roughly the same as it was a year ago, when 45% were very dissatisfied.
Extreme dissatisfaction peaked at 57% in October 2011 when overall satisfaction was just 13% and Americans' confidence in the economy was at near-record lows following a summer of volatile politicking in Washington over raising the debt ceiling.
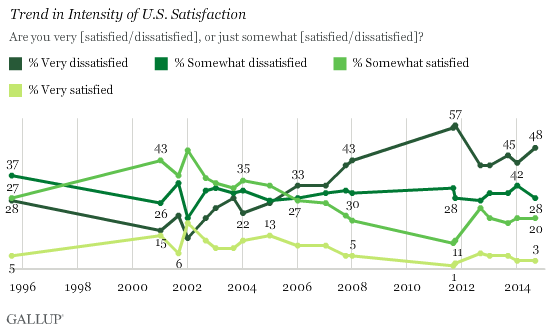
Although public dissatisfaction has exceeded satisfaction consistently since 2004, it is only since dissatisfaction topped 60% in late 2005 that Gallup has found more Americans very dissatisfied than somewhat dissatisfied with the way things are going.
Bottom Line
Americans' overall satisfaction with the direction of the country matches the steady trend seen all year, although the percentage very dissatisfied is up slightly. This comes less than two months before voters head to the polls in the midterm elections and is not a positive sign for the Democrats. As Gallup senior editor Jeff Jones noted in August, low U.S. satisfaction coupled with low job approval for the president typically results in heavy seat losses for the president's party during midterm elections. At 23%, satisfaction continues to be on track to be the lowest Gallup has ever recorded going into a midterm election, and Obama's subpar approval rating -- hovering at 40% -- will only reinforce the Democrats' problem, not alleviate it.
Survey Methods
Results for this Gallup poll are based on telephone interviews conducted Sept. 4-7, 2014, with a random sample of 1,017 adults, aged 18 and older, living in all 50 U.S. states and the District of Columbia.
For results based on the total sample of national adults, the margin of sampling error is ±4 percentage points at the 95% confidence level.
Interviews are conducted with respondents on landline telephones and cellular phones, with interviews conducted in Spanish for respondents who are primarily Spanish-speaking. Each sample of national adults includes a minimum quota of 50% cellphone respondents and 50% landline respondents, with additional minimum quotas by time zone within region. Landline and cellular telephone numbers are selected using random-digit-dial methods. Landline respondents are chosen at random within each household on the basis of which member had the most recent birthday.
Samples are weighted to correct for unequal selection probability, nonresponse, and double coverage of landline and cell users in the two sampling frames. They are also weighted to match the national demographics of gender, age, race, Hispanic ethnicity, education, region, population density, and phone status (cellphone only/landline only/both, and cellphone mostly). Demographic weighting targets are based on the most recent Current Population Survey figures for the aged 18 and older U.S. population. Phone status targets are based on the most recent National Health Interview Survey. Population density targets are based on the most recent U.S. census. All reported margins of sampling error include the computed design effects for weighting.
In addition to sampling error, question wording and practical difficulties in conducting surveys can introduce error or bias into the findings of public opinion polls.
View survey methodology, complete question responses, and trends.
For more details on Gallup's polling methodology, visit www.gallup.com.
