WASHINGTON, D.C. -- Gallup's U.S. Economic Confidence Index was steady in September, at -15 for the month, similar to the -16 it averaged in August. September's reading is also consistent with monthly scores throughout 2014, which have ranged from -14 to -17.
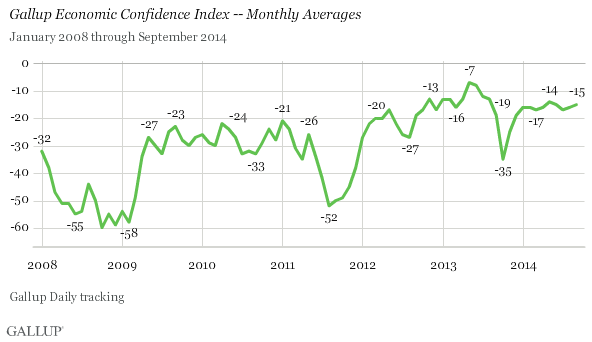
Though the index remains in negative territory, it has been unusually stable this year, compared with previous years. This year's index scores have generally exceeded those seen monthly since 2008, with the exception of a rise to the low single digits in mid-2013.
Economic confidence readings have been more positive in the last two weeks than earlier in September, including a -14 score for the final week of September and a -13 score for the week of Sept. 29-Oct. 5. Both are among the highest weekly readings of the year.
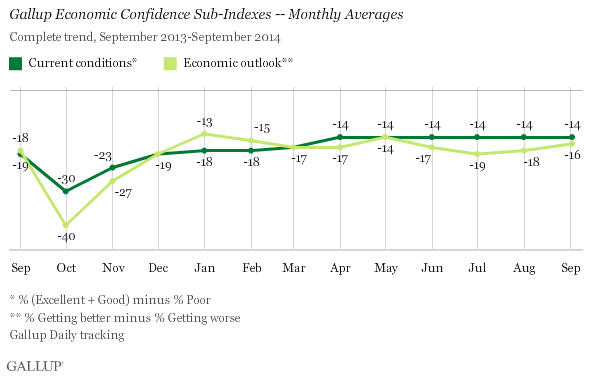
Gallup's Economic Confidence Index is the average of two components: how Americans view current economic conditions, and their perceptions of whether the economy is getting better or worse. In September, 20% said the economy is "excellent" or "good," while 34% said it is poor. This resulted in a current conditions dimension score of -14, the same current conditions score found for the past six months.
The economic outlook dimension has varied more, ranging from -13 to -19 this year -- though this range has still been much narrower than in previous years. In September, 39% of Americans said the economy is getting better, while 55% said it is getting worse. This resulted in an economic outlook score of -16 -- the best outlook score since May, when it was -14.
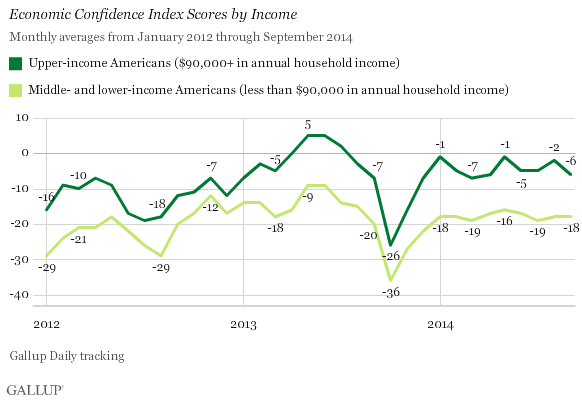
Upper-Income Americans' Confidence Dips, but Remains Higher
With just a few exceptions, Americans with annual household incomes of $90,000 or more have consistently had higher confidence in the economy than those in households with lower annual incomes.
Upper-income Americans had an index score of -6 in September, down four points from August. This is on the lower end of the -1 to -7 range for Americans in this income bracket in 2014. Lower- and middle-income Americans, meanwhile, averaged -18 -- the same as in August. These two income groups make up the large majority of Americans, and their confidence has varied less in 2014, ranging from -16 to -19.
Bottom Line
Americans' confidence in the economy in September did not stray from the track it has been on through 2014 so far. Those who follow the index's trajectory can take a small degree of comfort in the index's unusual stability, but may be left wondering when promising findings in job creation -- reinforced by last week's mostly positive government report on employment -- will translate to a more dramatic increase in economic confidence.
Though September's first three weeks bore results that were consistent with confidence throughout 2014, the final week's figure of -14, and last week's -13, could spell good things for October. It's too soon to know whether this is a meaningful shift into higher confidence, but it bears watching.
Gallup.com reports results from these indexes in daily, weekly, and monthly averages and in Gallup.com stories. Complete trend data are always available to view and export in the following charts:
Daily: Employment, Economic Confidence and Job Creation, Consumer Spending
Weekly: Employment, Economic Confidence, Job Creation, Consumer Spending
Read more about Gallup's economic measures.
View our economic release schedule.
Survey Methods
Results for this Gallup poll are based on telephone interviews conducted Sept. 1-30, 2014, on the Gallup Daily tracking survey, with a random sample of 14,636 adults, aged 18 and older, living in all 50 U.S. states and the District of Columbia.
For results based on the total sample of national adults, the margin of sampling error is ±1 percentage point at the 95% confidence level.
Interviews are conducted with respondents on landline telephones and cellular phones, with interviews conducted in Spanish for respondents who are primarily Spanish-speaking. Each sample of national adults includes a minimum quota of 50% cellphone respondents and 50% landline respondents, with additional minimum quotas by time zone within region. Landline and cellular telephone numbers are selected using random-digit-dial methods. Landline respondents are chosen at random within each household on the basis of which member had the most recent birthday.
Samples are weighted to correct for unequal selection probability, nonresponse, and double coverage of landline and cell users in the two sampling frames. They are also weighted to match the national demographics of gender, age, race, Hispanic ethnicity, education, region, population density, and phone status (cellphone only/landline only/both, and cellphone mostly). Demographic weighting targets are based on the most recent Current Population Survey figures for the aged 18 and older U.S. population. Phone status targets are based on the most recent National Health Interview Survey. Population density targets are based on the most recent U.S. census. All reported margins of sampling error include the computed design effects for weighting.
In addition to sampling error, question wording and practical difficulties in conducting surveys can introduce error or bias into the findings of public opinion polls.
For more details on Gallup's polling methodology, visit www.gallup.com.
