GALLUP NEWS SERVICE
PRINCETON, NJ -- Gallup's annual update on the images of various business and industry sectors in the country finds the restaurant industry, the computer industry, agriculture, and the grocery industry viewed most favorably by Americans. The oil and gas industry, typically the most negatively rated, saw its ratings decline even further this year as the prices of oil and gasoline reached new heights. Views of education, accounting, and agriculture are all up this year compared with 2004, while ratings of the oil and gas industry, the federal government, and the sports industry have declined and are now the lowest Gallup has measured for them. The image of the movie industry also took a hit this year.
Overall Rankings
Each year since 2001, Gallup has asked Americans to rate more than 20 business and industry sectors in the country on a five-point scale ranging from very positive to very negative. A net image score is calculated by subtracting the percentage saying "very negative" or "somewhat negative" from the percentage saying "very positive" or "somewhat positive." The middle rating of "neutral" is not factored into these scores.
The latest poll, conducted Aug. 8-11, finds that Americans have a net positive view (more people rating them positively than negatively) of 15 industries and a net negative view (more rating them negatively than positively) of 10.
|
Business and Industry Sector Ratings |
||||
|
|
Total |
|
Total |
Net |
|
% |
% |
% |
pct. pts. |
|
|
Restaurant industry |
58 |
31 |
8 |
+50 |
|
Computer industry |
57 |
30 |
10 |
+47 |
|
Farming and agriculture |
58 |
27 |
13 |
+45 |
|
Grocery industry |
58 |
27 |
15 |
+43 |
|
Retail industry |
52 |
31 |
15 |
+37 |
|
Travel industry |
48 |
35 |
13 |
+35 |
|
Accounting |
42 |
40 |
14 |
+28 |
|
Internet industry |
46 |
27 |
22 |
+24 |
|
Banking |
46 |
31 |
22 |
+24 |
|
Real estate industry |
46 |
29 |
23 |
+23 |
|
Education |
52 |
18 |
29 |
+23 |
|
Publishing industry |
42 |
35 |
20 |
+22 |
|
Automobile industry |
42 |
29 |
26 |
+16 |
|
Telephone industry |
40 |
31 |
27 |
+13 |
|
Airline industry |
38 |
32 |
27 |
+11 |
|
Electric and gas utilities |
36 |
24 |
38 |
-2 |
|
Television and radio industry |
35 |
25 |
38 |
-3 |
|
Sports industry |
33 |
26 |
38 |
-5 |
|
Advertising and public relations industry |
30 |
32 |
35 |
-5 |
|
Movie industry |
33 |
25 |
39 |
-6 |
|
The federal government |
33 |
20 |
45 |
-12 |
|
Pharmaceutical industry |
29 |
22 |
47 |
-18 |
|
Healthcare industry |
32 |
16 |
50 |
-18 |
|
The legal field |
27 |
24 |
47 |
-20 |
|
Oil and gas industry |
20 |
17 |
62 |
-42 |
At the top of the list is the restaurant industry, with a net positive rating of +50, followed by the computer industry (+47), farming and agriculture (+45), and the grocery industry (+43). Next on the list are the retail industry (+37), the travel industry (+35), accounting (+28), the Internet industry (+24), banking (+24), the real estate industry (+23), education (+23), and the publishing industry (+22). The automobile industry, the telephone industry, and the airline industry also receive net positive ratings from the public.
The oil and gas industry is by far the most negatively rated business sector, with a -42 net rating. Also near the bottom of the list are the legal field (-20), the healthcare industry (-18), the pharmaceutical industry (-18), and the federal government (-12). In addition, Americans rate the movie industry, advertising and public relations, the sports industry, television and radio, and the electric and gas utilities more negatively than positively.
Since 2001, the computer industry has consistently scored at the top of the list, with the exception of Gallup's 2002 poll, in which computers were tied with the restaurant industry in the top spot. The food industries (restaurants, grocery, and agriculture) usually fare well each year, as does the retail industry. The oil and gas industry has ranked at the bottom in each of the past five surveys, while the medical fields (healthcare and pharmaceuticals) and the legal field are also consistently among the most poorly rated.
Images of Education, Accounting, and Agriculture Improve This Year
The public's views of three business sectors improved considerably this year.
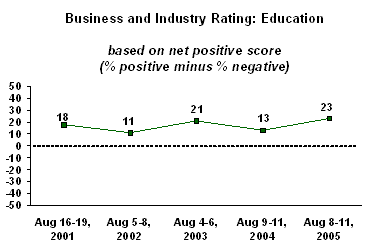
- Education. Americans' image of education in this country improved dramatically since last year, but is at roughly the same level as it was in 2003. In 2001, education had a +18 rating. This dipped slightly to +11 in 2002, but then jumped to +21 in 2003. Last year, it had a +13 rating, which increased this year to +23.
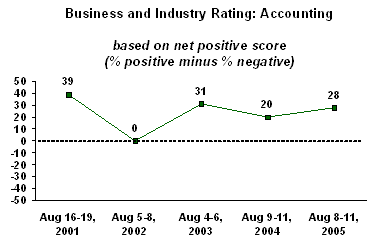
- Accounting. Even though the accounting sector fares better this year, these ratings are still lower than they were before the accounting scandals in late 2001 and 2002 at major corporations like Enron and WorldCom. The current score for the accounting sector is +28, up from +20 last year. In 2001, Americans rated this sector with a net +39 score, but after the accounting scandals came to light in 2002, its net score dropped to 0.
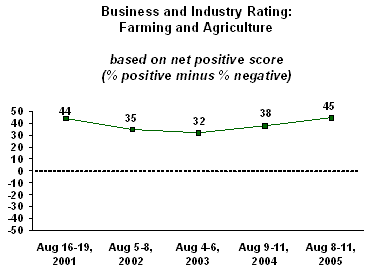
- Farming and agriculture. The public's view of this sector is higher now than it has been over the past three years, but is essentially the same as it was in 2001. Farming and agriculture received a +35 rating in 2002 and showed little change in 2003 and 2004, before edging up to a +45 score this year.
Views of Oil and Gas, Sports, Movies, and Federal Government Down
Americans' assessment of four business sectors declined this year.
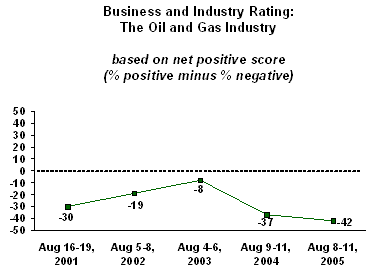
- The oil and gas industry. Since Gallup started asking this question, Americans' views of the oil and gas industry have always been at or near the bottom of the list of business sectors. However, with this year's soaring oil prices, the current poll finds that the ratings of the oil and gas industry are the worst that Gallup has ever measured. In 2001, the oil and gas industry received a net negative score of -30. These ratings improved in 2002 and again in 2003, with respective scores of -19 and -8, before growing more negative in 2004 (-37) and 2005 (-42).
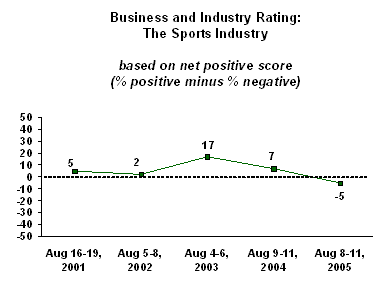
- The sports industry. Views of the sports industry dropped more than those for any other business sector this year. In 2001 and 2002, these ratings were essentially neutral, at +5 and +2, respectively. Then, ratings increased to +17 in 2003, before decreasing to +7 last year and then dropping significantly this year, to -5. The decline this year could be a result of revelations about steroid use in Major League Baseball or the National Hockey League strike that canceled the 2004-2005 season.
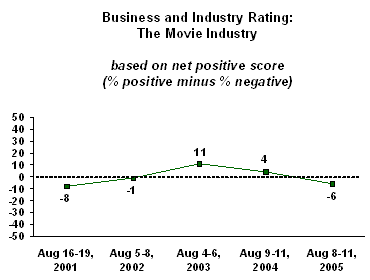
- The movie industry. Ratings of the movie industry in 2005 declined to levels that Gallup first measured in 2001. At that time, the industry received a -8 rating. This improved in 2002 (-1) and 2003 (+11), but dropped slightly in 2004 (+4). Views declined once again this year, to a -6 rating. The movie industry has received a lot of negative press due to a slump in box office revenue for much of the year and complaints about the quality of this year's crop of movies.
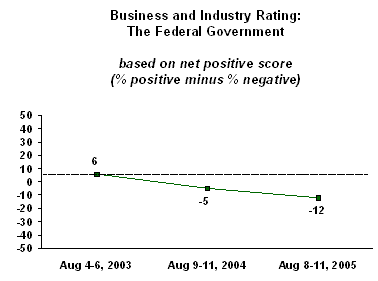
- The federal government. Gallup's image ratings of the federal government have declined each of the past three years. In 2003, the federal government scored a +6 rating; this decreased to -5 last year and again to -12 this year. Gallup polling this year has shown significant declines in public ratings of Congress and President George W. Bush.
Survey Methods
Results are based on telephone interviews with 1,001 national adults, aged 18 and older, conducted Aug. 8-11, 2005. For results based on the total sample of national adults, one can say with 95% confidence that the maximum margin of sampling error is ±3 percentage points.
For results based on the 497 national adults in the Form A half-sample and 504 national adults in the Form B half-sample, the maximum margins of sampling error are ±5 percentage points.
In addition to sampling error, question wording and practical difficulties in conducting surveys can introduce error or bias into the findings of public opinion polls.
38. On another subject, for each of the following business sectors in the United States, please say whether your overall view of it is very positive, somewhat positive, neutral, somewhat negative or very negative. How about -- [RANDOM ORDER]?
BASED ON 497 NATIONAL ADULTS IN FORM A
A. Accounting
|
|
Very |
Somewhat |
|
Somewhat |
Very |
No |
|
% |
% |
% |
% |
% |
% |
|
|
2005 Aug 8-11 |
9 |
33 |
40 |
11 |
3 |
4 |
|
2004 Aug 9-11 |
6 |
29 |
45 |
12 |
3 |
5 |
|
2003 Aug 4-6 |
8 |
37 |
37 |
10 |
4 |
4 |
|
2002 Aug 5-8 |
7 |
24 |
32 |
19 |
12 |
6 |
|
2001 Aug 16-19 |
10 |
37 |
40 |
7 |
1 |
5 |
B. Farming and agriculture
|
|
Very |
Somewhat |
|
Somewhat |
Very |
No |
|
% |
% |
% |
% |
% |
% |
|
|
2005 Aug 8-11 |
22 |
36 |
27 |
10 |
3 |
2 |
|
2004 Aug 9-11 |
19 |
31 |
34 |
9 |
3 |
4 |
|
2003 Aug 4-6 |
17 |
35 |
27 |
16 |
4 |
1 |
|
2002 Aug 5-8 |
16 |
35 |
28 |
12 |
4 |
5 |
|
2001 Aug 16-19 |
23 |
36 |
24 |
10 |
5 |
2 |
C. Automobile industry
|
|
Very |
Somewhat |
|
Somewhat |
Very |
No |
|
% |
% |
% |
% |
% |
% |
|
|
2005 Aug 8-11 |
10 |
32 |
29 |
19 |
7 |
3 |
|
2004 Aug 9-11 |
11 |
33 |
29 |
17 |
7 |
3 |
|
2003 Aug 4-6 |
12 |
40 |
27 |
14 |
5 |
2 |
|
2002 Aug 5-8 |
10 |
36 |
31 |
12 |
7 |
4 |
|
2001 Aug 16-19 |
11 |
34 |
28 |
20 |
6 |
1 |
D. Electric and gas utilities
|
|
Very |
Somewhat |
|
Somewhat |
Very |
No |
|
% |
% |
% |
% |
% |
% |
|
|
2005 Aug 8-11 |
11 |
25 |
24 |
26 |
12 |
2 |
|
2004 Aug 9-11 |
8 |
24 |
29 |
26 |
12 |
1 |
|
2003 Aug 4-6 |
12 |
33 |
23 |
21 |
10 |
1 |
|
2002 Aug 5-8 |
9 |
27 |
27 |
24 |
11 |
2 |
|
2001 Aug 16-19 |
9 |
22 |
21 |
30 |
17 |
1 |
E. Oil and gas industry
|
|
Very |
Somewhat |
|
Somewhat |
Very |
No |
|
% |
% |
% |
% |
% |
% |
|
|
2005 Aug 8-11 |
9 |
11 |
17 |
27 |
35 |
1 |
|
2004 Aug 9-11 |
6 |
15 |
18 |
35 |
23 |
3 |
|
2003 Aug 4-6 |
9 |
26 |
22 |
29 |
14 |
* |
|
2002 Aug 5-8 |
6 |
19 |
28 |
28 |
16 |
3 |
|
2001 Aug 16-19 |
7 |
17 |
21 |
33 |
21 |
1 |
|
* Less than 0.5% |
||||||
F. Banking
|
|
Very |
Somewhat |
|
Somewhat |
Very |
No |
|
% |
% |
% |
% |
% |
% |
|
|
2005 Aug 8-11 |
12 |
34 |
31 |
18 |
4 |
1 |
|
2004 Aug 9-11 |
15 |
31 |
34 |
14 |
3 |
3 |
|
2003 Aug 4-6 |
13 |
39 |
26 |
15 |
5 |
2 |
|
2002 Aug 5-8 |
12 |
34 |
29 |
17 |
7 |
1 |
|
2001 Aug 16-19 |
12 |
35 |
31 |
13 |
7 |
2 |
G. Restaurant industry
|
|
Very |
Somewhat |
|
Somewhat |
Very |
No |
|
% |
% |
% |
% |
% |
% |
|
|
2005 Aug 8-11 |
14 |
44 |
31 |
6 |
2 |
3 |
|
2004 Aug 9-11 |
15 |
43 |
32 |
6 |
1 |
3 |
|
2003 Aug 4-6 |
15 |
51 |
25 |
6 |
2 |
1 |
|
2002 Aug 5-8 |
16 |
45 |
28 |
7 |
1 |
3 |
|
2001 Aug 16-19 |
15 |
47 |
28 |
6 |
2 |
2 |
H. Grocery industry
|
|
Very |
Somewhat |
|
Somewhat |
Very |
No |
|
% |
% |
% |
% |
% |
% |
|
|
2005 Aug 8-11 |
17 |
41 |
27 |
11 |
4 |
* |
|
2004 Aug 9-11 |
14 |
38 |
31 |
13 |
2 |
2 |
|
2003 Aug 4-6 |
16 |
47 |
24 |
8 |
4 |
1 |
|
2002 Aug 5-8 |
18 |
40 |
25 |
13 |
3 |
1 |
|
2001 Aug 16-19 |
18 |
39 |
29 |
11 |
2 |
1 |
|
* Less than 0.5% |
||||||
I. Healthcare industry
|
|
Very |
Somewhat |
|
Somewhat |
Very |
No |
|
% |
% |
% |
% |
% |
% |
|
|
2005 Aug 8-11 |
12 |
20 |
16 |
32 |
18 |
2 |
|
2004 Aug 9-11 |
10 |
23 |
16 |
33 |
17 |
1 |
|
2003 Aug 4-6 |
11 |
31 |
12 |
28 |
17 |
1 |
|
2002 Aug 5-8 |
10 |
20 |
19 |
32 |
17 |
2 |
|
2001 Aug 16-19 |
11 |
26 |
19 |
29 |
15 |
* |
|
* Less than 0.5% |
||||||
J. Internet industry
|
|
Very |
Somewhat |
|
Somewhat |
Very |
No |
|
% |
% |
% |
% |
% |
% |
|
|
2005 Aug 8-11 |
15 |
31 |
27 |
18 |
4 |
5 |
|
2004 Aug 9-11 |
16 |
29 |
26 |
15 |
7 |
7 |
|
2003 Aug 4-6 |
16 |
35 |
25 |
15 |
5 |
4 |
|
2002 Aug 5-8 |
14 |
29 |
26 |
16 |
5 |
10 |
|
2001 Aug 16-19 |
14 |
30 |
26 |
20 |
7 |
3 |
K. The legal field
|
|
Very |
Somewhat |
|
Somewhat |
Very |
No |
|
% |
% |
% |
% |
% |
% |
|
|
2005 Aug 8-11 |
7 |
20 |
24 |
30 |
17 |
2 |
|
2004 Aug 9-11 |
6 |
21 |
28 |
27 |
15 |
3 |
|
2003 Aug 4-6 |
8 |
28 |
24 |
24 |
14 |
2 |
|
2002 Aug 5-8 |
4 |
18 |
35 |
24 |
15 |
4 |
|
2001 Aug 16-19 |
7 |
22 |
24 |
28 |
17 |
2 |
L. Advertising and public relations industry
|
|
Very |
Somewhat |
|
Somewhat |
Very |
No |
|
% |
% |
% |
% |
% |
% |
|
|
2005 Aug 8-11 |
9 |
21 |
32 |
27 |
8 |
3 |
|
2004 Aug 9-11 |
8 |
25 |
32 |
21 |
11 |
3 |
|
2003 Aug 4-6 |
9 |
32 |
29 |
19 |
8 |
3 |
|
2002 Aug 5-8 |
7 |
24 |
34 |
23 |
9 |
3 |
|
2001 Aug 16-19 |
10 |
28 |
28 |
23 |
9 |
2 |
M. Television and radio industry
|
|
Very |
Somewhat |
|
Somewhat |
Very |
No |
|
% |
% |
% |
% |
% |
% |
|
|
2005 Aug 8-11 |
12 |
23 |
25 |
26 |
12 |
2 |
|
2004 Aug 9-11 |
12 |
25 |
25 |
27 |
10 |
1 |
|
2003 Aug 4-6 |
11 |
34 |
24 |
23 |
8 |
* |
|
2002 Aug 5-8 |
11 |
31 |
24 |
23 |
9 |
2 |
|
2001 Aug 16-19 |
11 |
31 |
22 |
24 |
12 |
* |
|
* Less than 0.5% |
||||||
N. Movie industry
|
|
Very |
Somewhat |
|
Somewhat |
Very |
No |
|
% |
% |
% |
% |
% |
% |
|
|
2005 Aug 8-11 |
11 |
22 |
25 |
27 |
12 |
3 |
|
2004 Aug 9-11 |
10 |
27 |
26 |
20 |
13 |
4 |
|
2003 Aug 4-6 |
12 |
30 |
25 |
19 |
12 |
2 |
|
2002 Aug 5-8 |
12 |
22 |
27 |
22 |
13 |
4 |
|
2001 Aug 16-19 |
9 |
24 |
23 |
24 |
17 |
3 |
O. Sports industry
|
|
Very |
Somewhat |
|
Somewhat |
Very |
No |
|
% |
% |
% |
% |
% |
% |
|
|
2005 Aug 8-11 |
13 |
20 |
26 |
24 |
14 |
3 |
|
2004 Aug 9-11 |
12 |
27 |
26 |
22 |
10 |
3 |
|
2003 Aug 4-6 |
16 |
28 |
26 |
18 |
9 |
3 |
|
2002 Aug 5-8 |
15 |
20 |
28 |
22 |
11 |
4 |
|
2001 Aug 16-19 |
14 |
24 |
28 |
21 |
12 |
1 |
P. Publishing industry
|
|
Very |
Somewhat |
|
Somewhat |
Very |
No |
|
% |
% |
% |
% |
% |
% |
|
|
2005 Aug 8-11 |
10 |
32 |
35 |
14 |
6 |
3 |
|
2004 Aug 9-11 |
10 |
31 |
36 |
14 |
5 |
4 |
|
2003 Aug 4-6 |
12 |
34 |
37 |
11 |
4 |
2 |
|
2002 Aug 5-8 |
8 |
30 |
37 |
15 |
5 |
5 |
|
2001 Aug 16-19 |
12 |
35 |
32 |
13 |
5 |
3 |
Q. Pharmaceutical industry
|
|
Very |
Somewhat |
|
Somewhat |
Very |
No |
|
% |
% |
% |
% |
% |
% |
|
|
2005 Aug 8-11 |
10 |
19 |
22 |
25 |
22 |
2 |
|
2004 Aug 9-11 |
9 |
22 |
19 |
31 |
17 |
2 |
|
2003 Aug 4-6 |
12 |
31 |
18 |
22 |
16 |
1 |
|
2003 Aug 5-8 |
11 |
22 |
22 |
25 |
18 |
2 |
|
2001 Aug 16-19 |
12 |
27 |
22 |
24 |
14 |
1 |
R. Real estate industry
|
|
Very |
Somewhat |
|
Somewhat |
Very |
No |
|
% |
% |
% |
% |
% |
% |
|
|
2005 Aug 8-11 |
13 |
33 |
29 |
17 |
6 |
2 |
|
2004 Aug 9-11 |
15 |
32 |
31 |
15 |
4 |
3 |
|
2003 Aug 4-6 |
13 |
40 |
28 |
13 |
5 |
1 |
|
2002 Aug 5-8 |
12 |
35 |
32 |
13 |
4 |
4 |
|
2001 Aug 16-19 |
12 |
34 |
32 |
16 |
4 |
2 |
S. Education
|
|
Very |
Somewhat |
|
Somewhat |
Very |
No |
|
% |
% |
% |
% |
% |
% |
|
|
2005 Aug 8-11 |
17 |
35 |
18 |
24 |
5 |
1 |
|
2004 Aug 9-11 |
12 |
33 |
21 |
25 |
7 |
2 |
|
2003 Aug 4-6 |
13 |
38 |
18 |
20 |
10 |
1 |
|
2002 Aug 5-8 |
12 |
35 |
16 |
27 |
9 |
1 |
|
2001 Aug 16-19 |
13 |
37 |
18 |
23 |
9 |
* |
|
* Less than 0.5% |
||||||
T. Retail industry
|
|
Very |
Somewhat |
|
Somewhat |
Very |
No |
|
% |
% |
% |
% |
% |
% |
|
|
2005 Aug 8-11 |
10 |
42 |
31 |
11 |
4 |
2 |
|
2004 Aug 9-11 |
11 |
43 |
31 |
11 |
2 |
2 |
|
2003 Aug 4-6 |
7 |
47 |
29 |
14 |
2 |
1 |
|
2002 Aug 5-8 |
12 |
42 |
30 |
11 |
2 |
3 |
|
2001 Aug 16-19 |
12 |
35 |
34 |
14 |
3 |
2 |
U. Travel industry
|
|
Very |
Somewhat |
|
Somewhat |
Very |
No |
|
% |
% |
% |
% |
% |
% |
|
|
2005 Aug 8-11 |
12 |
36 |
35 |
10 |
3 |
4 |
|
2004 Aug 9-11 |
13 |
37 |
35 |
8 |
1 |
6 |
|
2003 Aug 4-6 |
9 |
40 |
33 |
11 |
4 |
3 |
|
2002 Aug 5-8 |
9 |
33 |
35 |
15 |
2 |
6 |
|
2001 Aug 16-19 |
11 |
39 |
35 |
11 |
2 |
2 |
V. Telephone industry
|
|
Very |
Somewhat |
|
Somewhat |
Very |
No |
|
% |
% |
% |
% |
% |
% |
|
|
2005 Aug 8-11 |
13 |
27 |
31 |
21 |
6 |
2 |
|
2004 Aug 9-11 |
10 |
28 |
28 |
23 |
8 |
3 |
|
2003 Aug 4-6 |
11 |
32 |
26 |
20 |
10 |
1 |
|
2002 Aug 5-8 |
10 |
24 |
27 |
24 |
13 |
2 |
|
2001 Aug 16-19 |
10 |
29 |
24 |
27 |
10 |
* |
|
* Less than 0.5% |
||||||
W. Airline industry
|
|
Very |
Somewhat |
|
Somewhat |
Very |
No |
|
% |
% |
% |
% |
% |
% |
|
|
2005 Aug 8-11 |
6 |
32 |
32 |
21 |
6 |
3 |
|
2004 Aug 9-11 |
6 |
32 |
33 |
20 |
3 |
6 |
|
2003 Aug 4-6 |
6 |
31 |
30 |
24 |
7 |
2 |
|
2002 Aug 5-8 |
7 |
24 |
33 |
24 |
6 |
6 |
|
2001 Aug 16-19 |
10 |
27 |
29 |
23 |
7 |
4 |
X. Computer industry
|
|
Very |
Somewhat |
|
Somewhat |
Very |
No |
|
% |
% |
% |
% |
% |
% |
|
|
2005 Aug 8-11 |
20 |
37 |
30 |
8 |
2 |
3 |
|
2004 Aug 9-11 |
20 |
40 |
26 |
6 |
2 |
6 |
|
2003 Aug 4-6 |
24 |
46 |
20 |
5 |
1 |
4 |
|
2002 Aug 5-8 |
20 |
42 |
24 |
5 |
4 |
5 |
|
2001 Aug 17-19 ^ |
27 |
40 |
20 |
9 |
1 |
3 |
|
|
|
|
|
|
|
|
|
^ BASED ON 326 NATIONAL ADULTS INTERVIEWED AUG. 17-19, 2001 |
||||||
Y. The federal government
|
|
Very |
Somewhat |
|
Somewhat |
Very |
No |
|
% |
% |
% |
% |
% |
% |
|
|
2005 Aug 8-11 |
6 |
27 |
20 |
31 |
14 |
2 |
|
2004 Aug 9-11 |
9 |
25 |
25 |
30 |
9 |
2 |
|
2003 Aug 4-6 |
9 |
32 |
23 |
22 |
13 |
1 |