Story Highlights
- Index averaged +1
- Monthly average -5 in December, highest month since 2008
- Yearly average was -15 in 2014, one point increase from 2013
WASHINGTON, D.C. -- Gallup's U.S. Economic Confidence Index averaged +1 for the week ending Jan. 4. This is consistent with +2 found the week prior, the first readings in positive territory since 2008.
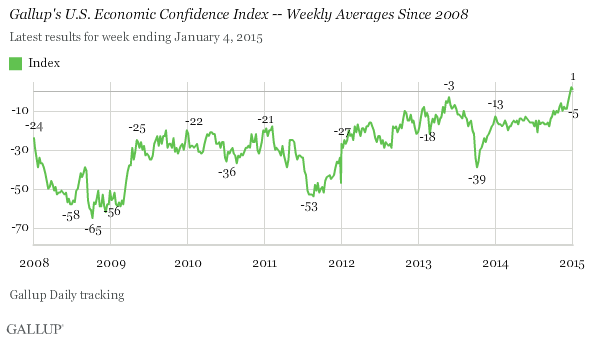
Gallup's Economic Confidence Index dropped as low as -65 in late 2008 after the government intervened to prevent the collapse of large financial institutions. Although it had generally moved up from that point, the index stayed in negative territory until two weeks ago. The previous weekly high was -3 in the week ending June 2, 2013.
There have been two notable dips in confidence since 2008. The first was a drop to -53 in late 2011 after federal government negotiations to raise the debt ceiling led to volatility in the stock market. And more recently in the fall of 2013, the index dropped to -39 after the partial federal government shutdown.
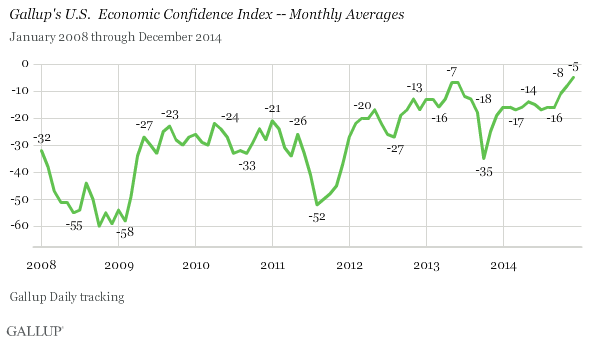
Monthly Economic Confidence Index -5 in December, Highest Since 2008
Despite the push into positive territory near the end of the month, slightly more pessimistic evaluations of the economy earlier in December held the monthly average for the Economic Confidence Index to -5. Still, this is the highest monthly average Gallup has found since daily tracking began in 2008, passing the previous high of-7 in May 2013.
Gallup's Economic Confidence Index is the average of two components: Americans' views of current economic conditions and their perceptions of whether the economy is getting better or getting worse. The index has a theoretical maximum of +100, if all Americans believe the economy is in excellent or good health and getting better. It has a theoretical minimum of -100, if all Americans rate the economy as poor and getting worse. Although those extremes are never likely to be reached, the index is constructed such that positive scores indicate Americans are positive about the economy overall and negative scores that they view it negatively.
In 2014, the monthly current conditions index improved early in the year before flattening out, but then showed sustained improvement in the fall and early winter months. Meanwhile, Americans' perceptions of the outlook for the economy fluctuated between showing increases and decreases before beginning a sustained period of improvement in September.
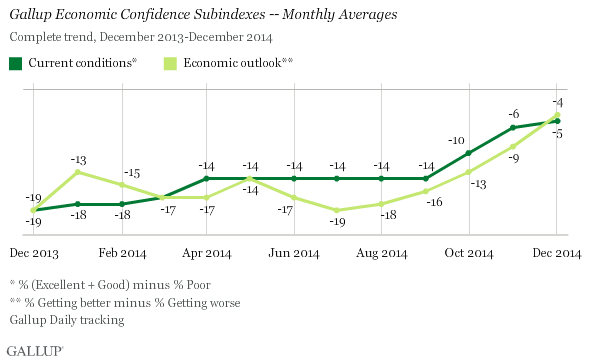
In December, 24% of Americans said the economy was "excellent" or "good" and 29% said it was "poor." This resulted in a current conditions score of -5, roughly the same as the -6 in November and among the highest monthly current conditions scores found since February 2008.
The economic outlook score increased five points to -4 in December, the highest monthly economic outlook score since May 2013. This was the result of 46% of Americans saying the economy was "getting better" while 50% said it was "getting worse."
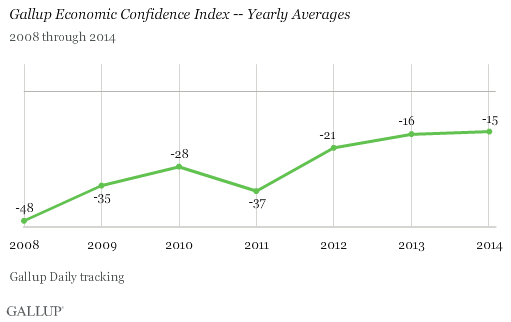
Yearly Economic Confidence Averaged -15 in 2014, Similar to 2013
While Gallup's Economic Confidence Index reached higher weekly levels in December than were found earlier in the year, 2014 as a whole was similar to 2013. The yearly average in 2014 was -15, just one point higher than -16 in 2013. This is attributable to the lower scores earlier in 2014, particularly in March and July when the monthly average was -17.
Implications
Americans' more positive views of the economy appear to be holding, as Gallup's Economic Confidence Index stayed in positive territory for a second consecutive week. And those positive weekly numbers could continue for the next several weeks because economic confidence typically increases in January. The monthly index has increased between one and 11 points between December and January each year since 2008.
A continuation of strong economic confidence scores in January 2015 could indicate that average Americans are picking up on signs of the economic recovery and more positive economic conditions. If index scores remain positive, it could signal future growth in the economy if these attitudes translate into more consumer spending and more hiring and investment among U.S. businesses.
Survey Methods
Results for this Gallup poll are based on telephone interviews conducted Dec.1-30, 2014, on the Gallup U.S. Daily survey, with a random sample of 13,165 adults, aged 18 and older, living in all 50 U.S. states and the District of Columbia. For results based on the total sample of national adults, the margin of sampling error is ±2 percentage points at the 95% confidence level. All reported margins of sampling error include computed design effects for weighting.
Each sample of national adults includes a minimum quota of 50% cellphone respondents and 50% landline respondents, with additional minimum quotas by time zone within region. Landline and cellular telephone numbers are selected using random-digit-dial methods.
Learn more about how Gallup Daily tracking works.