
Story Highlights
- P2P highest level Gallup has recorded in any January
- Voluntary and involuntary part-time work declines
- Unemployment up as more Americans return to the workforce
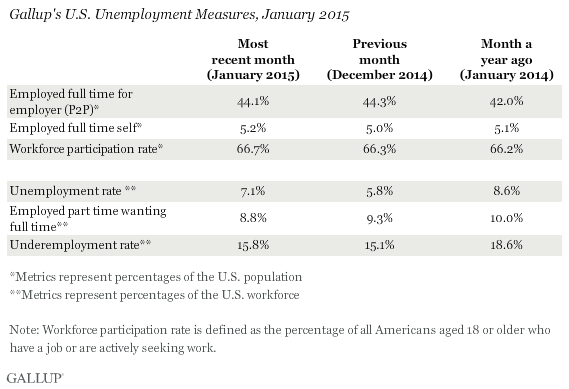
WASHINGTON, D.C. -- The U.S. Payroll to Population employment rate (P2P), as measured by Gallup, was 44.1% in January. This is statistically similar to the 44.3% measured in December, but it is the highest measurement of P2P for any January since Gallup began tracking the metric in 2010. January is typically one of the lowest months for P2P in any year.
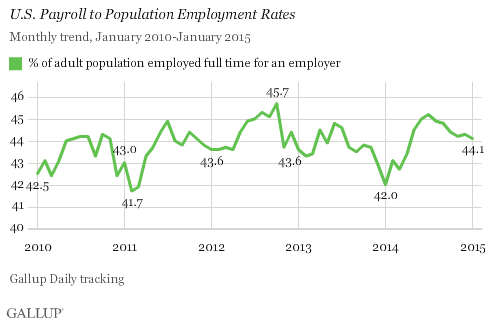
Gallup's P2P metric tracks the percentage of the U.S. adult population aged 18 and older who are employed by an employer for at least 30 hours per week. P2P is not seasonally adjusted. The latest results are based on Gallup Daily tracking interviews with 29,405 Americans, conducted Jan. 2-31 by landline telephone and cellphone. Gallup does not count adults who are self-employed, work fewer than 30 hours per week, who are unemployed or are out of the workforce as payroll-employed in the P2P metric.
Workforce Participation at 66.7%
Workforce participation among U.S. adults rose slightly from 66.3% in December to 66.7% in January. Workforce participation measures the percentage of adults aged 18 and older who are working, or who are not working but are actively looking for work and are available for employment.
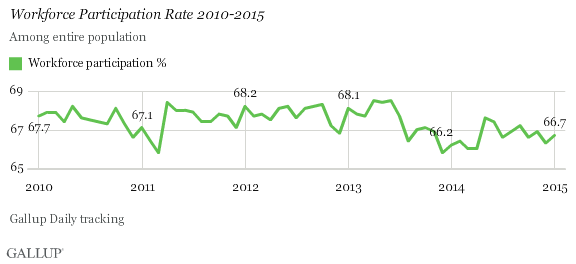
Since January 2010, the workforce participation rate has ranged narrowly between lows of 65.8% and highs of 68.5%, but since mid-2013 has most often registered below 67%. The small uptick this past month may be another positive sign that a strengthening economy is bringing discouraged workers back into the workforce. However, workforce participation does remain below the 2010-2014 average.
Unemployment Up to 7.1%
Gallup's U.S. unemployment rate represents the percentage of adults in the workforce who did not have any paid work in the past seven days, for an employer or themselves, and who were actively looking for and available to work. Gallup's unadjusted U.S. unemployment rate rose 1.3 percentage points to 7.1% in January, similar to the 1.2-point rise last January.
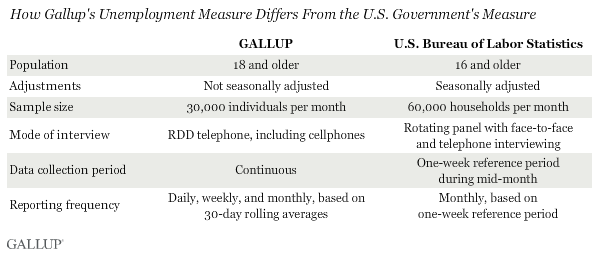
Unlike Gallup's P2P rate, which is a percentage of the total population, traditional employment metrics -- such as the unemployment rates Gallup and the U.S. Bureau of Labor Statistics (BLS) report -- are based on the percentage of the workforce. While both Gallup and BLS data are based on robust surveys, the two have important methodological differences. Additionally, the primary unemployment rate released by the BLS each month is seasonally adjusted. Although Gallup's employment numbers highly relate to BLS rates, Gallup's numbers tend to have more month-to-month variability, and the unemployment rate that the BLS reports each month does not always track precisely with the Gallup estimate.
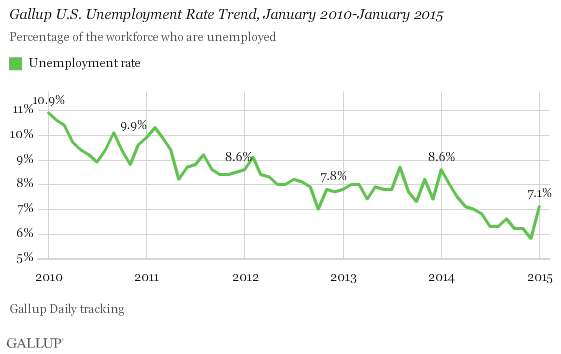
The rise in unemployment that Gallup recorded in January is partly attributable to seasonal effects -- unemployment always rises in January, both in BLS figures and in Gallup's measures since 2011. In January 2015, as in January 2014, 18- to 24-year-olds saw the biggest increase in unemployment, as did those with the lowest reported monthly incomes, typical of more seasonal and part-time workers laid off after the end of the holiday season.
January's rise in unemployment is also partly related to the rise in the number of Americans who were previously considered out of the workforce and who are now looking for new jobs. This is one scenario where a rise in unemployment may be considered "good news" economically, as more of the adult population becomes motivated to seek work even if they may not have found it quite yet. While about half of the rise in unemployment is accounted for by lower rates of part-time work, the other half is accounted for by increased workforce participation. Overall, Gallup saw a surge from December in the percentage of nonworking Americans who said they are looking for work, from 14.9% to 17.5%, and who said they are able to work, from 38.8% to 40.1%.
Underemployment Up at 15.8%
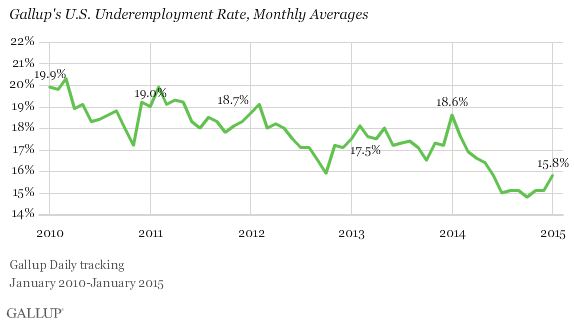
Gallup's measure of underemployment in January is 15.8%, up from the level registered in December, but still lower than what Gallup has measured in prior years. Gallup's U.S. underemployment rate combines the percentage of adults in the workforce who are unemployed (7.1%) and those who are working part time but desire full-time work (8.8%); these two figures add to 15.8% due to rounding. While Gallup's measure of unemployment rose in January, the percentage working part time but who want full- time work fell slightly at the same time, resulting in a smaller half-point increase in the underemployment rate.
Bottom Line
U.S. employment measures show continued positive signs for the economy in January 2015. Employment growth has been stronger in the past 12 months than in any year since Gallup began tracking these metrics in January 2010. P2P was higher in January in 2015 than in any previous year, hopefully setting the stage for continued strength in the months ahead. Unadjusted unemployment rose by more than a point, but the underlying combination of more workforce participation and lower rates of part-time work that appear to drive this increase make this counterintuitively good news.
In the context of this good news, the headline increase in unemployment underscores why this figure is only one of a number of important indicators of economic health. Gallup's unadjusted unemployment increased in January for seasonal reasons and because of increased workforce participation -- a sign of improving economic health. The real test for whether the U.S. economy is truly improving will be the rate of full-time employment going forward, especially the P2P rate. The U.S. needs many more full-time jobs to regain the ground lost since 2008 and to show real catch-up job growth.
Gallup.com reports results from these indexes in daily, weekly, and monthly averages and in Gallup.com stories. Complete trend data are always available to view and export in the following charts:
Daily: Employment, Economic Confidence and Job Creation, Consumer Spending
Weekly: Employment, Economic Confidence, Job Creation, Consumer Spending
Read more about Gallup's economic measures.
View our economic release schedule.
Survey Methods
Results for this Gallup poll are based on telephone interviews conducted Jan. 2-31, 2015, on the Gallup U.S. Daily survey, with a random sample of 29,405 adults, aged 18 and older, living in all 50 U.S. states and the District of Columbia. For results based on the total sample of national adults, the margin of sampling error is ±1 percentage points at the 95% confidence level. All reported margins of sampling error include computed design effects for weighting.
Each sample of national adults includes a minimum quota of 50% cellphone respondents and 50% landline respondents, with additional minimum quotas by time zone within region. Landline and cellular telephone numbers are selected using random-digit-dial methods.
Learn more about how the Gallup U.S. Daily works.
