Story Highlights
- Medicaid expansion, state exchanges linked to greater reductions
- No state reported a statistically significant increase in uninsured
- Nationwide, full-year uninsured rate drops 3.5 points from 2013 to 2014
This story is part of Gallup's annual "State of the States" series, which reveals state-by-state differences on political, economic, religion and well-being measures.
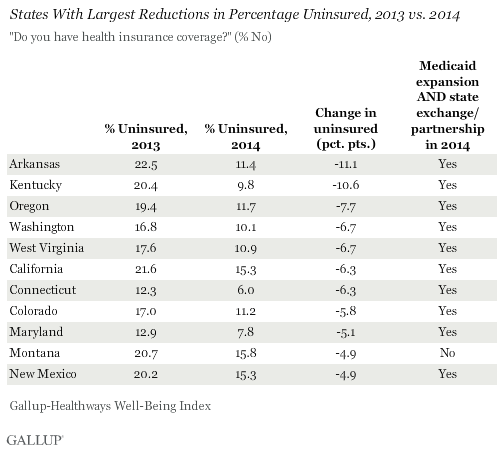
WASHINGTON, D.C. -- Arkansas and Kentucky reported the sharpest reductions in their uninsured rates among adult residents since the healthcare law's requirement to have insurance took effect at the beginning of 2014. Oregon, Washington and West Virginia round out the top five. Of the 11 states with the greatest reductions, 10 expanded Medicaid and established a state-based marketplace exchange or state-federal partnership. Montana, which is tied for 10th, is the only exception.
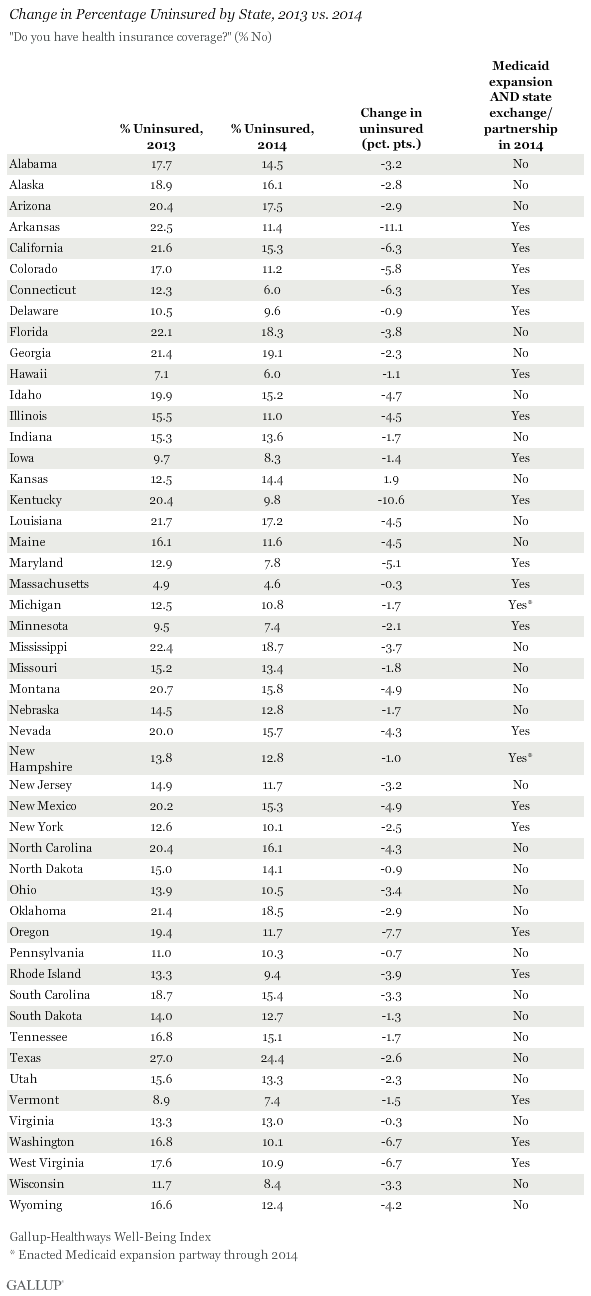
Nationwide, the uninsured rate dropped 3.5 percentage points last year, from 17.3% to 13.8%, the lowest annualized rate across the seven years of Well-Being Index measurement. No state reported a statistically significant increase in the percentage of uninsured in 2014 compared with 2013.
These data, collected as part of the Gallup-Healthways Well-Being Index, are based on respondents' answers to the question, "Do you have health insurance coverage?" These state-level data are based on daily surveys conducted from January through December 2014 and include samples sizes that range from 465 randomly selected adult residents in North Dakota to nearly 17,000 in California.
States Embracing Multiple Parts of Health Law Continue to See More Improvement
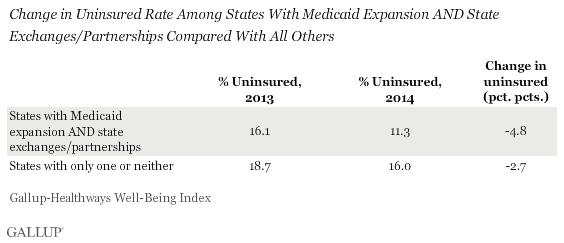
Collectively, the uninsured rate in states that have chosen to expand Medicaid and set up their own state exchanges or partnerships in the health insurance marketplace declined significantly more last year than the rate in states that did not take these steps. The uninsured rate declined 4.8 points in the 21 states that implemented both of these measures, compared with a 2.7-point drop across the 29 states that have implemented only one or neither of these actions.
See the end of the article for a full list of the status of Medicaid expansion and state exchanges for all 50 states, and the 2013 and 2014 uninsured rates for each.
Massachusetts Maintains Lowest Uninsured Rate in U.S., Texas the Highest
Overall, Massachusetts has the lowest uninsured rate in the nation for the seventh consecutive year, at 4.6%, followed by 6.0% uninsured in Connecticut and Hawaii. Massachusetts' plan is based on the "Romneycare" model, from which certain aspects of the Affordable Care Act were drawn. The Massachusetts healthcare law, originally passed in 2006, has undergone modifications to accommodate details of the federal law, but maintains its core element mandating that nearly all residents must obtain a minimum level of insurance coverage.
Also for the seventh consecutive year, Texas has the highest uninsured rate at 24.4%, although this percentage is lower than the 27.0% reported in 2013 and is the lowest rate measured to date for Texas.
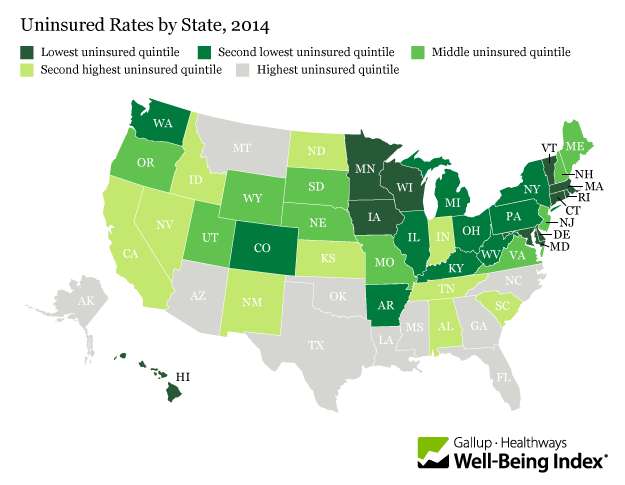
States with the lowest uninsured rates continue to cluster in the East and upper Midwest. Uninsured rates are highest in the South and the West.
Implications
While a majority of Americans continue to disapprove of the Affordable Care Act, it has clearly had an impact in reducing the uninsured rate in the U.S., which declined to its lowest point in seven years by the last quarter of 2014. This trend could be poised to continue, as 55% of Americans who remain uninsured plan to get health insurance rather than pay a fine.
States that have implemented two of the law's core mechanisms -- Medicaid expansion and state health exchanges -- are seeing a substantially larger drop in the uninsured rate than states that did not take both of these actions. Consequently, the gap in uninsured rates that existed between these two groups in 2013 nearly doubled in 2014.
Many states continue to debate implementing these actions. In addition to New Hampshire last August, Indiana and Pennsylvania both enacted Medicaid expansion in 2015, becoming the 27th and 28th states (plus the District of Columbia) to expand Medicaid. Utah Gov. Gary Herbert continues negotiations with the Centers for Medicare and Medicaid Services to have a plan with revised, more flexible terms than what is detailed in the Affordable Care Act, currently known as the Healthy Utah plan.
Change Analysis Rules
Some states have chosen to implement state-federal "partnership" exchanges, where states manage certain functions and make key decisions based on local market and demographic conditions. For the purposes of this analysis, these partnerships are included with the state exchanges. States with Medicaid expansion that occurred after the midyear point in 2014 were excluded from the "States With Medicaid Expansion and State Exchange/Partnerships" group. For example, New Hampshire, which manages a state-based exchange but did not enact Medicaid expansion until Aug. 15, 2014, is excluded. Michigan, in turn, is included as it manages a state-based exchange and enacted Medicaid expansion effective April 1, 2014. Four states -- North Dakota, New Jersey, Ohio and Arizona -- decided to expand Medicaid without also administering a state-based exchange or partnership, while several others continue to debate expansion. Pennsylvania enacted Medicaid expansion effective Jan. 1, 2015, and Indiana will do so on Feb. 1. The District of Columbia, which has expanded Medicaid and has implemented a locally managed exchange, is not included in this analysis.
Survey Methods
Results are based on telephone interviews conducted Jan. 2-Dec. 30, 2013, and Jan. 2-Dec. 30, 2014, as part of the Gallup-Healthways Well-Being Index, with a random sample of 178,072 adults in 2013 and 176,702 adults in 2014, aged 18 and older, living in all 50 U.S. states and the District of Columbia. The margin of sampling error is ±1 to ±2 percentage points for most states, but is close to ±4 percentage points for states with small populations such as North Dakota, Wyoming, Vermont and Alaska. All reported margins of sampling error include computed design effects for weighting.
Each sample of national adults includes a minimum quota of 50% cellphone respondents and 50% landline respondents, with additional minimum quotas by time zone within region. Landline and cellular telephone numbers are selected using random-digit-dial methods.
Learn more about how the Gallup-Healthways Well-Being Index works.