Story Highlights
- In February, self-reported spending averaged $82
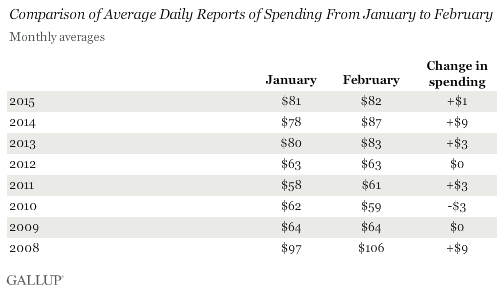
- February average is level with the average in January
- In six of eight years, February spending unchanged from January
WASHINGTON, D.C. -- Americans' daily self-reports of spending averaged $82 in February. This is similar to the $81 in January, but slightly lower than the February average from last year.
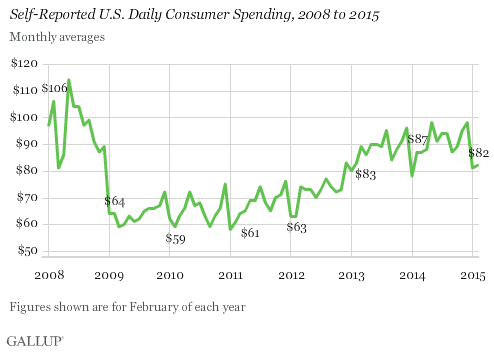
Each day, Gallup asks Americans to estimate the total amount they spent "yesterday" in restaurants, gas stations, stores or online -- not counting home and vehicle purchases, or normal monthly bills -- to provide an indication of Americans' discretionary spending. The February 2015 average is based on Gallup Daily tracking interviews with 13,672 U.S. adults.
The daily spending average fell $17 between December and January -- a sharp drop, but one that is typical after the holiday shopping season. Spending has generally been level between January and February since polling began in 2008. Two years, 2008 and 2014, saw significant February increases. But the changes have not been statistically significant in all other years.
Spending Steady for Both Upper- and Lower-Income Americans
Average self-reports of spending were essentially steady in February among upper- and middle-/lower-income Americans. Spending among middle- and lower-income Americans -- all those whose annual household income is less than $90,000 a year -- averaged $71 in February, level with January. Spending among upper-income Americans averaged $137, also unchanged from January.
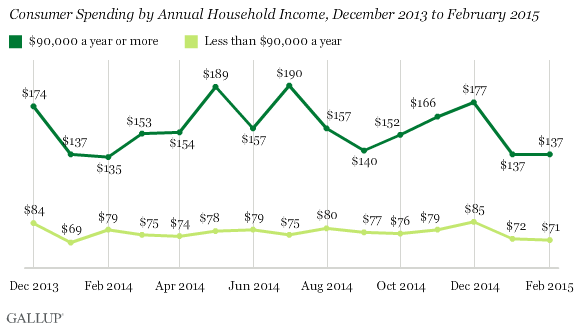
Middle- and lower-income Americans make up the bulk of U.S. consumers, and their spending is typically more stable month-to-month and lower than what is seen among upper-income Americans. At $71, spending among middle-/lower-income Americans was down last month compared with February 2014, when it averaged $79 -- largely explaining the year-over-year drop in overall spending. Gallup saw no meaningful change in upper-income Americans' spending from year to year.
Implications
Americans' daily self-reported spending was level in February compared with January, but down slightly compared with February 2014. Gallup's Economic Confidence Index fell during the third week in February, returning to negative territory, and stayed there in Daily tracking since then. Furthermore, last year, a Harvard Business Review study found that consumers are less likely to spend money when it's cold. And the Midwest, Northeast and Southern U.S. experienced colder-than-normal weather for much of February. Given these factors, the lack of change in U.S. spending last month may not be surprising.
Survey Methods
Results for this Gallup poll are based on telephone interviews conducted Feb. 1-28, 2015, on the Gallup U.S. Daily survey, with a random sample of 13,672 adults, aged 18 and older, living in all 50 U.S. states and the District of Columbia. For results based on the total sample of national adults, the margin of sampling error is ±1 percentage point at the 95% confidence level. The margin of error for the spending mean is ±$4. All reported margins of sampling error include computed design effects for weighting.
Each sample of national adults includes a minimum quota of 50% cellphone respondents and 50% landline respondents, with additional minimum quotas by time zone within region. Landline and cellular telephone numbers are selected using random-digit-dial methods.
Learn more about how Gallup Daily tracking works.