
Story Highlights
- Economic Confidence Index fell two points in February
- This is first monthly drop in confidence since last July
- Confidence declined in second half of month as gas prices rose
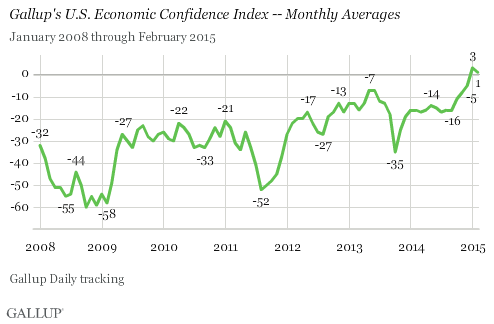
WASHINGTON, D.C. -- After scoring +3 in January, the first positive reading in seven years, Gallup's Economic Confidence Index edged down to +1 in February. The reading last month is still the second-highest monthly average since Gallup began tracking confidence on a daily basis in 2008.
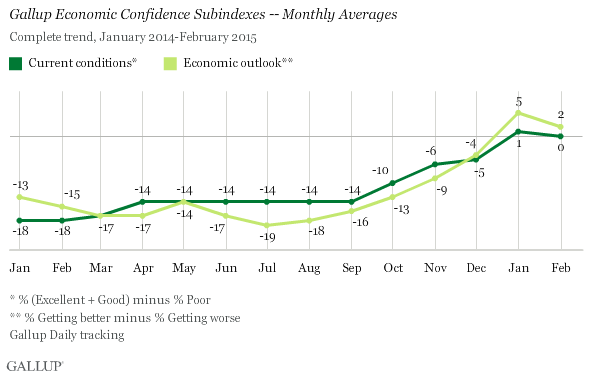
Gallup's Economic Confidence Index is the average of two components: Americans' ratings of current economic conditions and their views on whether the economy is getting better or getting worse. The index has a theoretical maximum of +100, if all Americans believe the economy is excellent or good and getting better; and a theoretical minimum of -100, if all Americans say the economy is poor and getting worse.
In Gallup Daily tracking throughout February, an average 27% of Americans said the economy was "excellent" or "good," while 27% said it was "poor." The resulting "0" current conditions score compares with +1 in January. Meanwhile, the economic outlook score decreased by three points to +2, based on 49% of Americans saying the economy is "getting better" and 47% "getting worse."
Index Dropped Significantly in Last Two Weeks of February
The modest drop in Americans' economic confidence in February reflects significantly different readings in the two halves of the month. Americans' economic confidence indexed at +3 in each of the first two weeks of the month -- on par with the January average -- but was followed by a five-point drop to -2 in the third week of the month, and remained at that level last week.
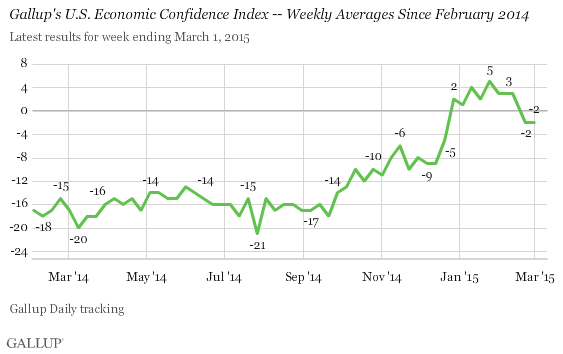
The shift in the last two weeks of February marks the largest downturn in weekly economic confidence since last July. Although there are a number of possible causes for the drop, one probable explanation is the higher prices consumers are seeing at the gas pump, an unwelcome turn after seven months of declining gas prices. The average price per gallon of regular unleaded gas nationally rose three cents in the first week of February, then 12 cents in the second week, eight cents in the third and six cents in the fourth -- 29 cents in total.
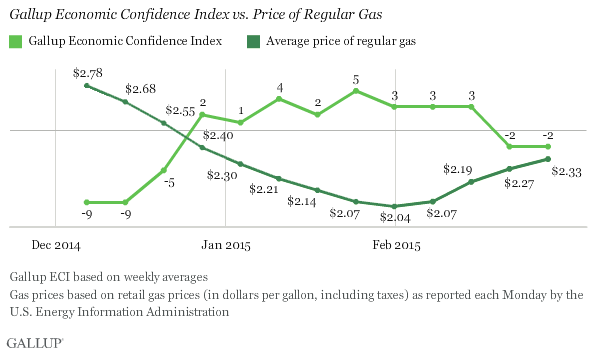
Gas prices started going up at least a week before Americans' economic confidence began to sink, suggesting if there is a relationship between the two, it could depend on the cumulative effect after a series of short-term increases.
On the other hand, the stock market had its best month in more than three years in February, with the Dow Jones rising 5.6% and the Nasdaq up 7.1%. Thus, among the many economic signals consumers may respond to, rising gas prices appeared to overshadow rising stocks in February.
Bottom Line
The trend toward rising economic confidence halted in February. Gallup's index fell out of positive territory at mid-month, resulting in a monthly decline from January. This is the first time since last July that monthly confidence declined to any degree. With experts predicting that gas prices will continue to rise into the spring because of reduced production at U.S. refineries, and assuming gas prices affect how Americans look at the economy, it could be difficult for economic confidence to recover its recent momentum without significantly positive economic news elsewhere.
Survey Methods
Results for this Gallup poll are based on telephone interviews conducted Feb. 1-28, 2015, on the Gallup U.S. Daily survey, with a random sample of 13,171 adults, aged 18 and older, living in all 50 U.S. states and the District of Columbia. For results based on the total sample of national adults, the margin of sampling error is ±1 percentage point at the 95% confidence level. All reported margins of sampling error include computed design effects for weighting.
Each sample of national adults includes a minimum quota of 50% cellphone respondents and 50% landline respondents, with additional minimum quotas by time zone within region. Landline and cellular telephone numbers are selected using random-digit-dial methods.
Learn more about how Gallup Daily tracking works.
