
Story Highlights
- P2P highest Gallup has recorded in any March since 2010
- Unemployment now 6.4%; involuntary part-time work at 9.1%
- Workforce participation statistically steady at 66.8%
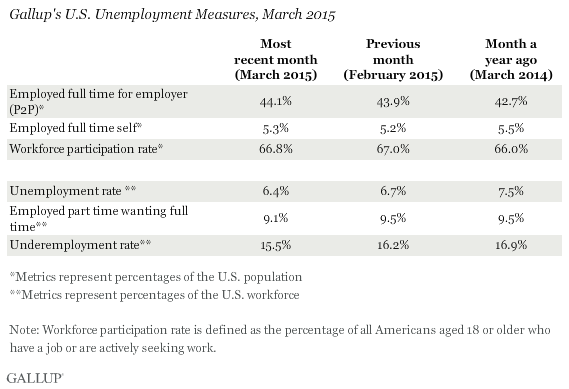
WASHINGTON, D.C. -- The U.S. Payroll to Population employment rate (P2P), as measured by Gallup, was 44.1% in March. This is statistically similar to the 43.9% measured in February and identical to the 44.1% measured in January. It is also the highest measurement of P2P for any March since Gallup began tracking the metric daily in 2010. P2P typically begins to pick up again in March and April of any year, rising through the summer months from lows in January and February.
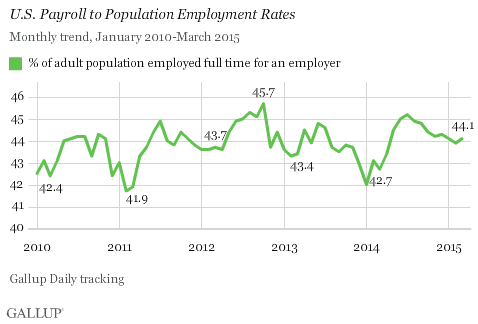
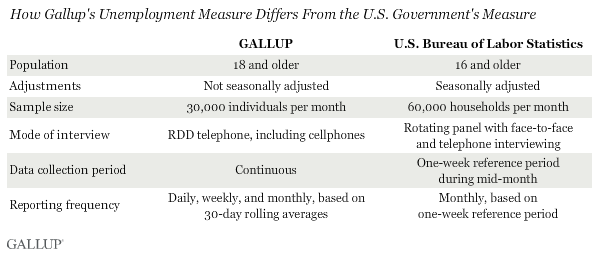
Gallup's P2P metric tracks the percentage of the U.S. adult population aged 18 and older who are employed by an employer for at least 30 hours per week. P2P is not seasonally adjusted. The latest results are based on Gallup Daily tracking interviews with 31,428 Americans, conducted March 1-31 by landline telephone and cellphone. Gallup does not count adults who are self-employed, work fewer than 30 hours per week, who are unemployed or are out of the workforce as payroll-employed in the P2P metric.
Overall, P2P is an important measure of the health of the economy; P2P tracks most closely with other objective measures of economic productivity such as GDP per capita, as well as with subjective measures such as life evaluations and physical well-being.
Workforce Participation at 66.8% in March
Workforce participation among U.S. adults was statistically steady from the 67.0% measured in February to 66.8% in March. Workforce participation measures the percentage of adults aged 18 and older who are working, or who are not working but are actively looking for work and are available for employment.
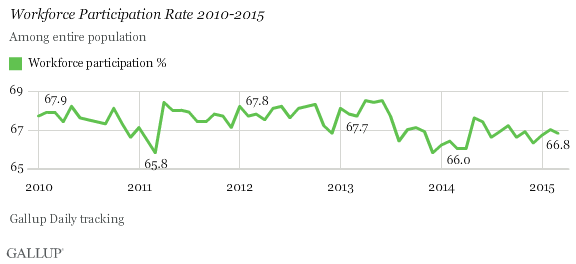
Since March 2010, the workforce participation rate has ranged narrowly between lows of 65.8% and highs of 68.5%, but since mid-2013 has most often registered below 67.0%. Gallup began recording this metric in January 2010, but Bureau of Labor Statistics (BLS) figures prior to that show that labor force participation before the 2008-2009 crisis was three percentage points higher than it is today, and has yet to recover from that decline. The decline in workforce participation in part reflects demographic changes in the adult population as increasing numbers of baby boomers retire, but also lower rates of participation among those in their prime working years.
Unemployment Down to 6.4%
Gallup's U.S. unemployment rate represents the percentage of adults in the workforce who did not have any paid work in the past seven days, for an employer or themselves, and who were actively looking for and available to work. Gallup's unadjusted U.S. unemployment rate fell 0.3 percentage points to 6.4% in March, the lowest rate for March by more than a point since Gallup began tracking unemployment daily in 2010.
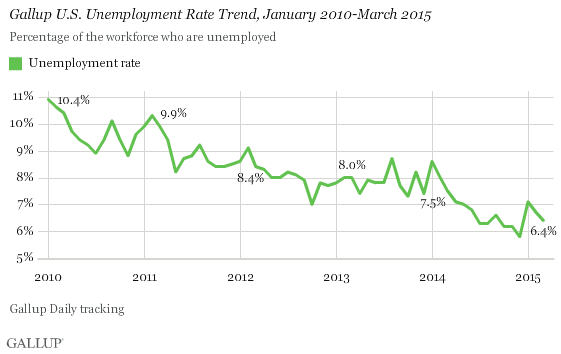
Unlike Gallup's P2P rate, which is a percentage of the total population, traditional employment metrics -- such as the unemployment rates Gallup and the BLS report -- are based on the percentage of the workforce. While both Gallup and BLS data are based on robust surveys, the two have important methodological differences. Additionally, the primary unemployment rate released by the BLS each month is seasonally adjusted. Although Gallup's employment numbers highly relate to BLS rates, Gallup's numbers tend to have more month-to-month variability, and the unemployment rate that the BLS reports each month does not always track precisely with the Gallup estimate.
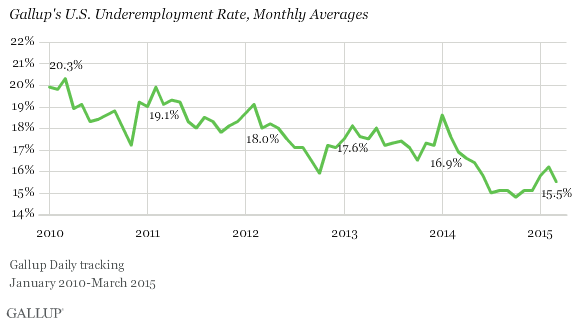
Underemployment Down at 15.5%
Gallup's measure of underemployment in March is 15.5%, the lowest level for March since Gallup began daily tracking in 2010. Gallup's U.S. underemployment rate combines the percentage of adults in the workforce who are unemployed (6.4%) and those who are working part time but desire full-time work (9.1%). Both Gallup's measure of unemployment and of the percentage working part time but who want full-time work fell in March, resulting in a 0.7-point decrease in the underemployment rate.
Bottom Line
In the past several months, several of Gallup's employment metrics have reached their most positive points since Gallup began tracking them in January 2010, including higher P2P rates and lower unemployment and underemployment rates. This is good news for job seekers and the U.S. economy more generally, and both the P2P and unemployment figures for March 2015 continue that trend, raising hopes for continued strength into the spring and summer. In fact, that would be the expectation given that improvement in Gallup's employment metrics through the spring and summer months is typical.
However, workforce participation has continued to languish. In March, underemployment fell by 0.5 points as a percentage of the adult population, but full-time employment rose only 0.3 points. The rest of the difference was people exiting the workforce. This phenomenon explains why unemployment has steadily fallen in recent years but wages have not risen and employment rates have mostly held steady.
The data in this article are available in Gallup Analytics.
Gallup.com reports results from these indexes in daily, weekly, and monthly averages and in Gallup.com stories. Complete trend data are always available to view and export in the following charts:
Daily: Employment, Economic Confidence and Job Creation, Consumer Spending
Weekly: Employment, Economic Confidence, Job Creation, Consumer Spending
Read more about Gallup's economic measures.
View our economic release schedule.
Survey Methods
Results for this Gallup poll are based on telephone interviews conducted Mar. 1-31, 2015, on the Gallup U.S. Daily survey, with a random sample of 31,428 adults, aged 18 and older, living in all 50 U.S. states and the District of Columbia. For results based on the total sample of national adults, the margin of sampling error is ±1 percentage points at the 95% confidence level. All reported margins of sampling error include computed design effects for weighting.
Each sample of national adults includes a minimum quota of 50% cellphone respondents and 50% landline respondents, with additional minimum quotas by time zone within region. Landline and cellular telephone numbers are selected using random-digit-dial methods.
Learn more about how the Gallup U.S. Daily works.
