Story Highlights
- Index up two points from March
- Previous high was +30 in September
- Hiring perceptions among nongovernment workers at new high
WASHINGTON, D.C. -- Gallup's U.S. Job Creation Index reached +31 for the month of April, inching past its previous high of +30 from September of last year. This latest reading is up two points from March, and is a break from six months of fairly static measurements.
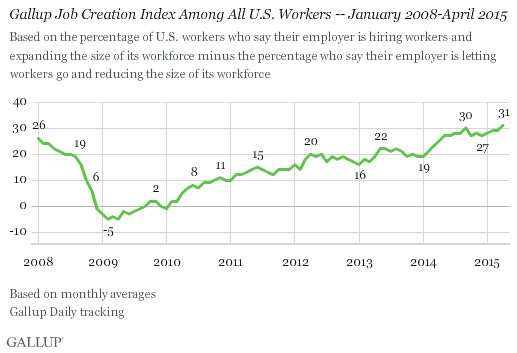
Since hitting a low point of -5 on two separate occasions in 2009, the U.S. Job Creation Index has climbed fairly steadily over the past six years. The first five months of 2014 saw steady increases in monthly readings of the index, rising from +19 in January to +27 in May. Since then, the index has mostly stayed between +27 and +29, apart from the higher readings last September and this April.
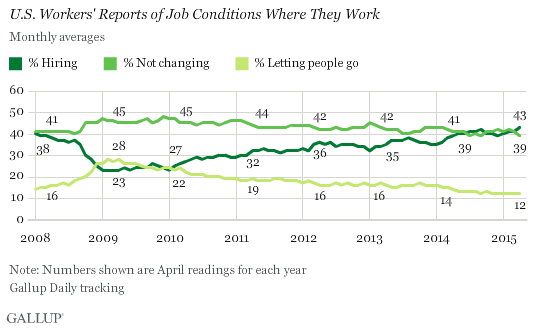
Gallup's Job Creation Index is a measure of net hiring activity in the U.S., with the April average based on a nationally representative sample of more than 16,000 full- and part-time workers. Last month's +31 score is the result of 43% of employees saying their employer is hiring workers and expanding the size of its workforce, and 12% saying their employer is letting workers go and reducing the size of its workforce. While the latter figure is unchanged from March, slightly more American workers said their employers were hiring in April (43%) than said this in March (41%).
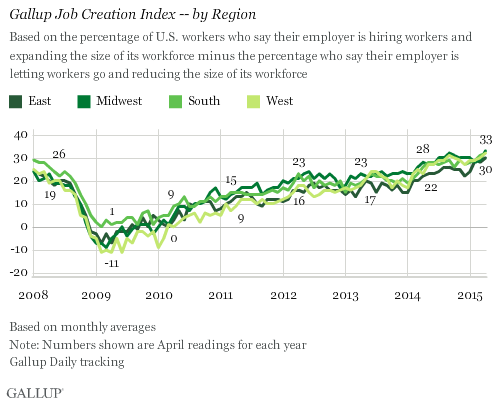
New Job Creation Index Highs for All Regions
For the first time since Gallup began tracking the index in 2008, index scores are +30 or higher in all four regions of the country. Each region has a new high index score, with the Midwest leading the other regions at +33 in April. The index score in the East had never reached the +30 mark before the latest poll.
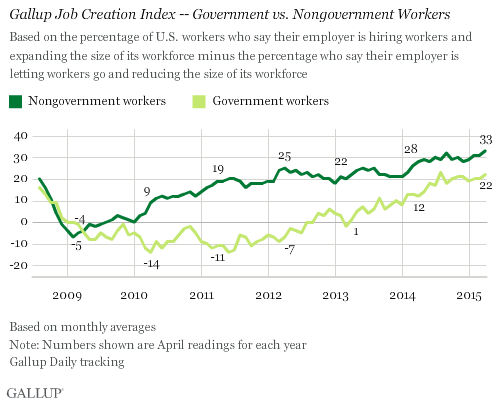
New High for Perceptions of Hiring Among Nongovernment Workers
Both government and nongovernment workers reported slightly greater hiring activity, with a two-point increase in each of their index scores for the month of April. For nongovernment workers, last month's +33 is a new high in their net hiring perceptions, edging past the +32 in September. The +22 score among government workers is one point below the high from last August. Perceptions of hiring among nongovernment workers have consistently been stronger than those of their government counterparts in nearly all of Gallup's readings over the years.
Bottom Line
More American workers have reported that their employers were hiring over the past year than in the six years prior, with the latest data from April representing a new high mark.
As the U.S. economy has improved over the past several years, Gallup has seen steady increases in its Job Creation Index as well as the Economic Confidence Index that measures Americans' assessment of the broader national economy. However, in 2015 to date, the Economic Confidence Index has shown at least some decline since the beginning of the year, from an average +3 in January to -3 in April, while the Job Creation Index has been steady or up each month. This suggests that while hiring activity is an important part of how Americans view the larger economy, other factors, such as gas prices or economic growth, also enter into Americans' perceptions of how the economy is doing overall.
Survey Methods
Results for this Gallup poll are based on telephone interviews conducted April 1-30, 2015, on the Gallup U.S. Daily survey, with a random sample of 16,398 adults, aged 18 and older, living in all 50 U.S. states and the District of Columbia, who are employed full or part time. For results based on the total sample of national adults, the margin of sampling error is ±1 percentage point at the 95% confidence level. All reported margins of sampling error include computed design effects for weighting.
Each sample of national adults includes a minimum quota of 50% cellphone respondents and 50% landline respondents, with additional minimum quotas by time zone within region. Landline and cellular telephone numbers are selected using random-digit-dial methods.
Learn more about how Gallup Daily tracking works.