
Story Highlights
- Economic Confidence Index averaged -5
- Four-point increase from the week prior
- Largest weekly increase since mid-March
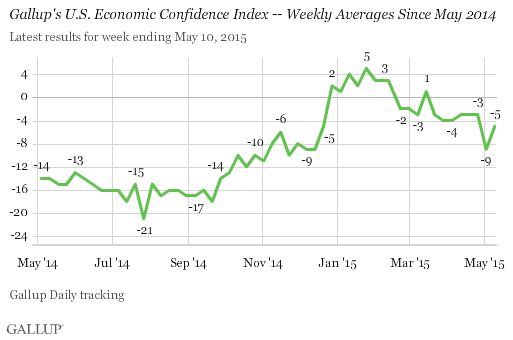
WASHINGTON, D.C. -- Gallup's Economic Confidence Index has mostly recovered after a sharp drop to -9 for the week ending May 3, the lowest weekly score since December 2014. The average of -5 for the week ending May 10 is in line with most of the weekly scores since late March.
The last week in April was filled with bad news. The U.S. government announced that the GDP had hardly grown in the first quarter of 2015. U.S. gas prices continued to increase, which Gallup has previously found to factor into Americans' ratings of the economy. And violent protests and riots shook the city of Baltimore. All of this bad news could have cast a pall on Americans' ratings of the economy, triggering a drop in economic confidence.
Last week, however, the Economic Confidence Index returned to the levels more typical of the past 12 weeks, suggesting the bad economic news may have had a more temporary effect on Americans' views of the economy rather than fundamentally altering their perspective. The Bureau of Labor Statistics' unemployment report did bring some positive economic news at the end of last week, although that so far does not appear to have made Americans any more positive about the economy than they have been for the past few months.
Last week's four-point increase from the week prior is the largest weekly increase since the week ending March 15, when the index also increased four points and briefly re-entered positive territory.
Assessments of Current Conditions, Economic Outlook Recover
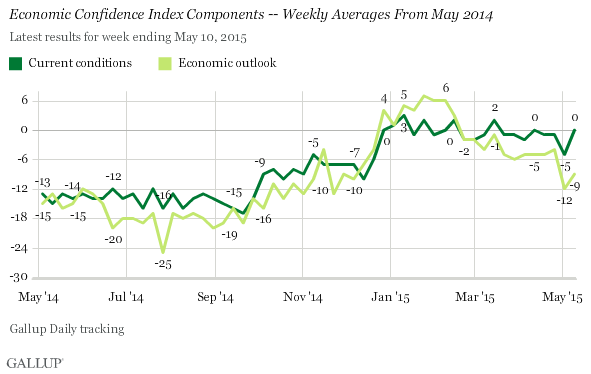
Gallup's Economic Confidence Index is the average of two components: how Americans rate current economic conditions and their views of whether the economy is getting better or worse. The theoretical maximum of the index is +100, if all Americans rate the economy well and say it is getting better, while the theoretical minimum is -100, if all Americans rate the economy poorly and say it is getting worse. Since early March, Americans have generally been more positive about current economic conditions than they have been about the outlook for the economy. And after dropping sharply the week prior, both components increased last week.
The current conditions score rebounded five points to reach 0, the result of 28% of Americans saying the economy is "excellent" or "good" while 28% said it is "poor." The economic outlook score also increased, from -12 to -9, after 43% of Americans said the economy is "getting better" while 52% said it is "getting worse." This economic outlook score is still slightly lower than what Gallup found each week from December to late April.
Bottom Line
Americans' views of the economy rebounded last week after falling sharply the week before when disappointing economic statistics may have prompted some Americans to question the economy's strength. But as those stories faded from the news cycle, they also seemed to fade from Americans' minds when evaluating the economy. A positive jobs report from the Bureau of Labor Statistics and the stock market's strong reaction to it came later in the week, after Americans' confidence had already largely recovered from the prior week. While Americans remain less confident than they were in January and February of this year, they are much more optimistic than they were for most of 2014.
The data in this article are available in Gallup Analytics.
Survey Methods
Results for this Gallup poll are based on telephone interviews conducted May 4-10, 2015, on the Gallup U.S. Daily survey, with a random sample of 3,551 adults, aged 18 and older, living in all 50 U.S. states and the District of Columbia. For results based on the total sample of national adults, the margin of sampling error is ±2 percentage points at the 95% confidence level. All reported margins of sampling error include computed design effects for weighting.
Each sample of national adults includes a minimum quota of 50% cellphone respondents and 50% landline respondents, with additional minimum quotas by time zone within region. Landline and cellular telephone numbers are selected using random-digit-dial methods.
Learn more about how Gallup Daily tracking works.
