Story Highlights
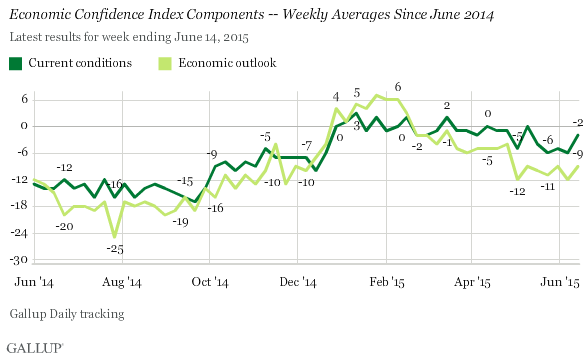
- Current conditions score at -2
- Economic outlook score up, at -9
- Confidence has tracked with changes in gas prices
WASHINGTON, D.C. -- Gallup's Economic Confidence Index averaged -6 for the week ending June 14. This reading continues the trend in generally lower confidence levels over the last several months, compared with the readings in positive territory in late 2014 and early 2015.
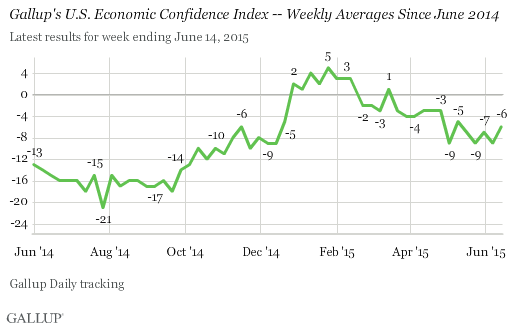
Gallup's Economic Confidence Index is the average of two components: Americans' views of current economic conditions and their perceptions of whether the U.S. economy is getting better or getting worse. The theoretical maximum for the index is +100, if all Americans say the economy is excellent or good and getting better. The theoretical minimum is -100, if all Americans say the economy is poor and getting worse.
The downturn in Americans' economic confidence so far this year has stemmed more from their negatively tilting expectations for the economy than from their ratings of current conditions. The economic outlook score was -9 for the week ending June 14, based on 43% of Americans saying the economy is getting better and 52% saying it is getting worse. This spring's downtick in expectations is a significant shift; earlier this year, more Americans said the economy was getting better than said it was getting worse. Americans' ratings of current economic conditions, the other index component, are slightly more negative than positive (25% excellent or good and 27% poor), resulting in a score of -2.
The current drop in confidence marks the largest decline in the index since it plummeted after the government shutdown in the fall of 2013. Unlike 2013, there is no single government action that can be pinpointed as being behind this year's drop, leaving a number of possible causes. But one explanation that fits the data is gas prices, which dropped at the end of last year just as confidence was increasing, and rose again beginning in February just as economic confidence began to decline.
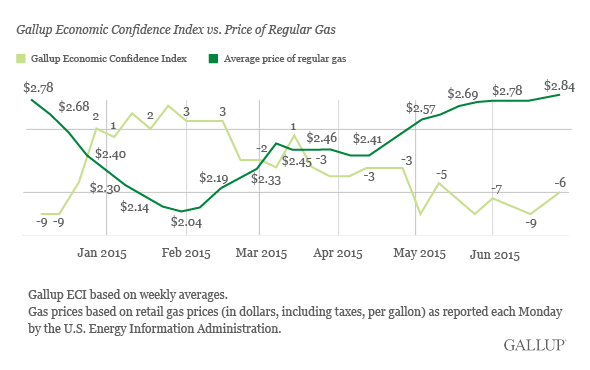
Although still low on a long-term basis, gas prices have been significantly higher in recent months than the lows of near $2 a gallon to which they dropped at the beginning of the year. Prices nationwide have risen to about $2.80 a gallon over the past several weeks and, concomitantly, the Economic Confidence Index has dropped to well below the break-even point, including the previous week's -9 and last week's -6.
The way gas prices factor into consumers' thinking about the national economy isn't totally clear. But gas prices, along with prices more generally, are one aspect of the economy that consumers come into direct contact with frequently and on an ongoing basis, something that cannot be said about more remote economic factors such as GDP growth and housing sales. The drop to near $2 per gallon may have been so dramatic that it temporarily improved Americans' outlook about the economy, boosting their economic confidence, only to see that lift deflate with the quick return of gas prices to where they had been last November.
Bottom Line
Americans' outlook on the U.S. economy remains more negative than positive, as it has every week since March. Similarly, the price of a gallon of gas, on average, remains much higher than it was at the beginning of the year -- albeit still lower than in recent years. Although many varied factors are related to Americans' views of the economy, this relationship suggests that one significant concern weighing on their minds when asked about economic conditions is what they most recently paid for gas at the pump.
These data are available in Gallup Analytics.
Survey Methods
Results for this Gallup poll are based on telephone interviews conducted June 8-14, 2015, on the Gallup U.S. Daily survey, with a random sample of 3,554 adults, aged 18 and older, living in all 50 U.S. states and the District of Columbia. For results based on the total sample of national adults, the margin of sampling error is ±2 percentage points at the 95% confidence level. All reported margins of sampling error include computed design effects for weighting.
Each sample of national adults includes a minimum quota of 50% cellphone respondents and 50% landline respondents, with additional minimum quotas by time zone within region. Landline and cellular telephone numbers are selected using random-digit-dial methods.
Learn more about how Gallup Daily tracking works.