Story Highlights
- Spending for June consistent with that for April, May
- June 2015 spending similar to June 2013, 2014
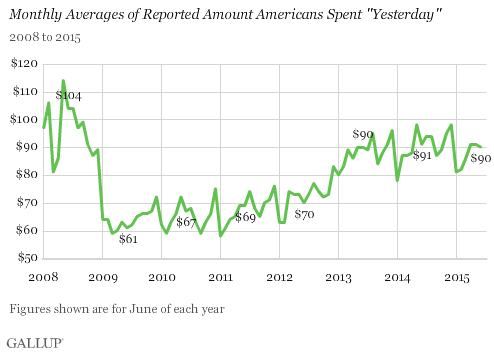
WASHINGTON, D.C. -- Americans' daily self-reports of spending averaged $90 for the month of June, essentially unchanged from the previous two months. The latest average is also consistent with the June averages in 2013 and 2014.
Gallup's daily spending measure asks Americans to estimate the total amount they spent "yesterday" in restaurants, gas stations, stores or online -- not counting home, vehicle or other major purchases, or normal monthly bills -- to provide an indication of Americans' discretionary spending. The June 2015 average is based on Gallup Daily tracking interviews with more than 14,000 U.S. adults.
Americans' reported spending had been rather stagnant from 2009-2012 on the heels of the global financial crisis. Beginning in late 2012, the metric began to rise and continued to do so into 2013. Since then, it has hovered around the $90 mark, compared with much lower averages near the $70 mark in 2009-2012.
Although this year's June average is no different from the June 2013 and 2014 averages, it remains well above the June figures Gallup recorded between 2009 and 2012. Spending each June has typically dipped slightly compared with May, making the $1 decline this year consistent with the average $3 decline each June from 2009 through 2014. Spending between June and July, however, has usually increased a little, so it could increase this month as well.
Bottom Line
From a recent vantage point, the lack of increase in spending could be related to Americans' stagnant view of the economy as a whole. Gas prices dipped slightly during the second half of June, so the lower costs could mean Americans are recalibrating their spending in accordance with the relief they're feeling at the pump.
The recent Fourth of July weekend was slated to have the lowest holiday weekend gas prices in five years. Given the usual bump in July spending, the national holiday had the potential to kick off a heightened level of month-long spending.
These data are available in Gallup Analytics.
Survey Methods
Results for this Gallup poll are based on telephone interviews conducted June 1-30, 2015, on the Gallup U.S. Daily survey, with a random sample of 14,685 adults, aged 18 and older, living in all 50 U.S. states and the District of Columbia. For results based on the total sample of national adults, the margin of sampling error is ±1 percentage point at the 95% confidence level. The margin of error for the spending mean is ±$5. All reported margins of sampling error include computed design effects for weighting.
Each sample of national adults includes a minimum quota of 50% cellphone respondents and 50% landline respondents, with additional minimum quotas by time zone within region. Landline and cellular telephone numbers are selected using random-digit-dial methods.
Learn more about how Gallup Daily tracking works.