Story Highlights
- Percentage viewing Internet positively jumps to 60%
- Industry image improves more among Republicans than Democrats
- Older Americans catching up with young adults in positive views
PRINCETON, N.J. -- Six in 10 Americans view the Internet industry either very or somewhat positively, which is up from 49% a year ago and easily the highest positive rating that Gallup has recorded in 15 years.
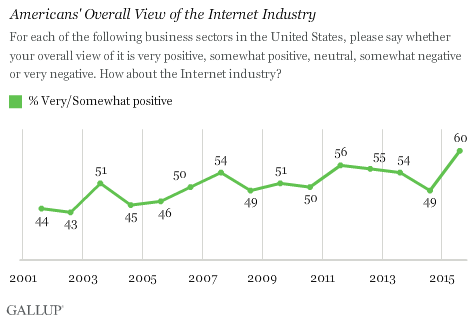
Positive perceptions of the Internet industry rose from an average 46% between 2001 and 2005 to 52% between 2006 and 2014, before reaching today's 60%. Currently, 16% of Americans view the industry negatively -- up from an average 22% from 2001 to 2005 -- and 22% are neutral toward it.
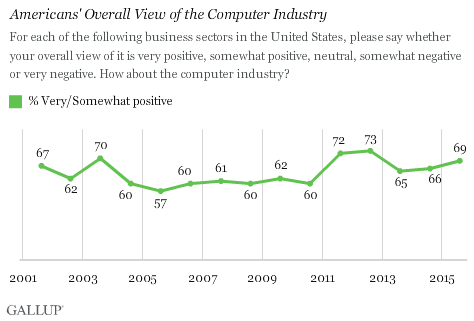
The latest results are from Gallup's Aug. 5-9 Work and Education poll, in which respondents were asked how they view each of 25 business or industry sectors in the U.S. The Internet now ranks third on the basis of net-positive views, behind the restaurant and computer industries. While Americans rate the computer industry slightly better than the Internet industry, views of the computer industry have been fairly flat in recent years; in fact, the current 69% viewing it positively is a few points lower than the 73% peak three years ago.
"Internet industry" may mean different things to different people, and Gallup did not define the term in the question, but experts generally define it as companies that provide access to or operate primarily on the Internet. This would include Internet portals and search engines, as well as e-commerce, lifestyle, entertainment and social media sites.
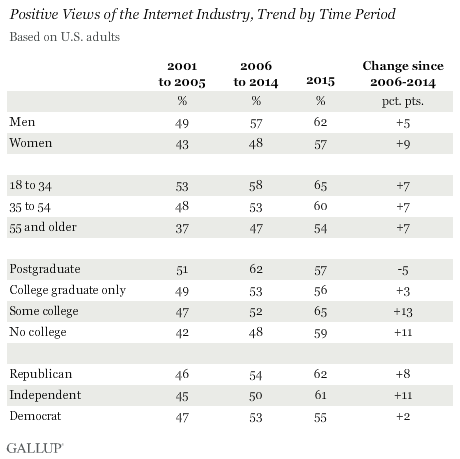
While there is no obvious reason why Americans would have grown more favorable toward the Internet industry in just the past year, Gallup trends indicate that positive perceptions are higher today than the 2006-2014 average among most key demographic groups. It has increased especially among Republicans and independents, while showing little improvement among Democrats.
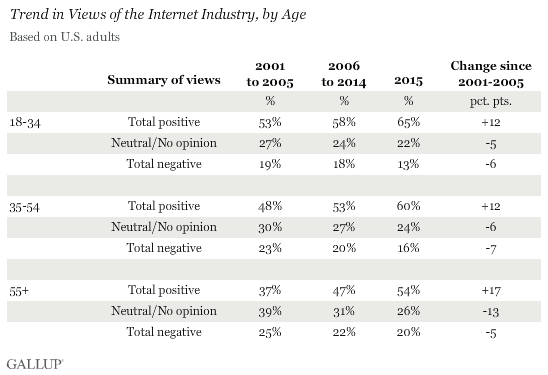
Longer term, one of the reasons the Internet industry's image has improved since the early 2000s is that older Americans have grown more positive toward it as they have become more familiar with it. From 2001-2005, 37% of adults aged 55 and older had a positive impression of the Internet industry and 25% a negative impression, with 39% neutral or unsure. Today, 54% view it positively and 20% negatively, with 26% neutral or unsure.
Bottom Line
As more Americans have Internet access at home, use smartphones, telecommute and otherwise integrate the Internet in their lives, their perceptions of the industry have improved. The Internet provides services that can enhance people's daily lives, and at least for now, it appears these benefits outweigh any downside Americans may perceive in terms of cost or privacy. One question is whether consumers continue to feel the Internet is on their side, or whether they grow to want more government intervention. However, amid current debate over the merits of various proposed regulations, it is notable that far more Americans have a positive view of the Internet industry than of the federal government, 60% vs. 25%, respectively.
Historical data are available in Gallup Analytics.
Survey Methods
Results for this Gallup poll are based on telephone interviews conducted Aug. 5-9, 2015, with a random sample of 1,011 adults, aged 18 and older, living in all 50 U.S. states and the District of Columbia. For results based on the total sample of national adults, the margin of sampling error is ±4 percentage points at the 95% confidence level. Each industry was rated by a random subset of approximately 500 respondents. The margin of sampling error is ±6 percentage points at the 95% confidence level. All reported margins of sampling error include computed design effects for weighting.
Each sample of national adults includes a minimum quota of 50% cellphone respondents and 50% landline respondents, with additional minimum quotas by time zone within region. Landline and cellular telephone numbers are selected using random-digit-dial methods.
View complete question responses and trends.
Learn more about how Gallup Poll Social Series works.