Story Highlights
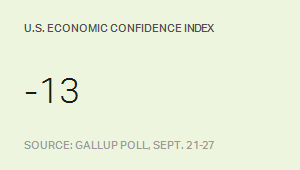
- Economic Confidence Index averaged -13, consistent with recent weeks
- Views of current conditions remain better than economic outlook
WASHINGTON, D.C. -- Gallup's U.S. Economic Confidence Index was level at -13 for the week ending Sept. 27, marking the fourth consecutive week the index has averaged between -12 and -14. This is slightly better than the 2015 low of -17 from the end of August, but worse than what Gallup measured earlier this year.
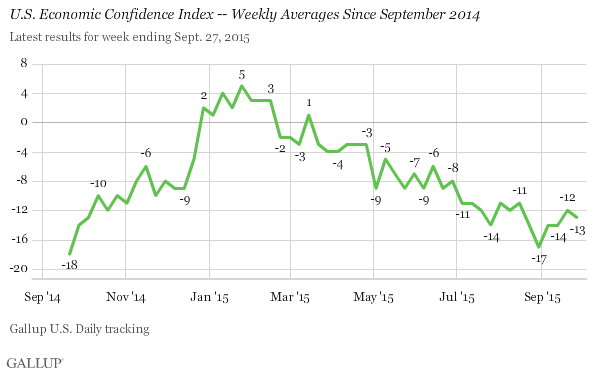
Although the current Economic Confidence Index score is near the lower end of the index's range so far in 2015, it is still higher than it has been for most of the post-recession period that began in 2009.
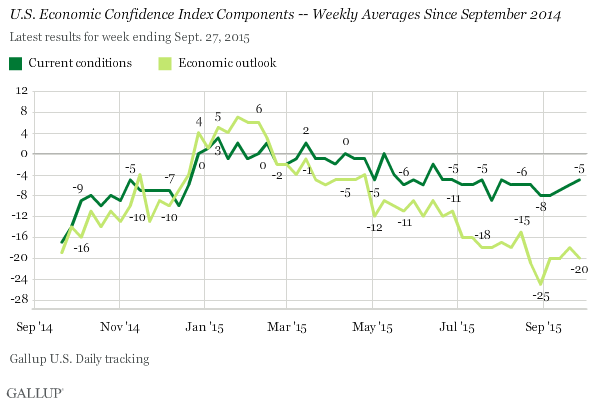
Gallup's Economic Confidence Index is the average of two components: how Americans rate the current economy and whether they say the economy is "getting better" or "getting worse." Neither component had a major change for the week ending Sept. 27. Since March, Americans have rated current economic conditions more positively than they have viewed the economic outlook.
The current conditions component averaged -5 last week, the result of 25% of Americans rating the current economy as "excellent" or "good" and 30% rating it "poor." This remains slightly better than the -8 found in late August and early September.
The economic outlook component averaged -20, the result of 38% of Americans saying the economy is getting better and 58% saying it is getting worse. The outlook component had fallen as low as -25 in late August.
These data are available in Gallup Analytics.
Survey Methods
Results for this Gallup poll are based on telephone interviews conducted Sept. 21-27, 2015, on the Gallup U.S. Daily survey, with a random sample of 3,562 adults, aged 18 and older, living in all 50 U.S. states and the District of Columbia. For results based on the total sample of national adults, the margin of sampling error is ±2 percentage points at the 95% confidence level. All reported margins of sampling error include computed design effects for weighting.
Each sample of national adults includes a minimum quota of 60% cellphone respondents and 40% landline respondents, with additional minimum quotas by time zone within region. Landline and cellular telephone numbers are selected using random-digit-dial methods.
Learn more about how the Gallup U.S. Daily works.