Story Highlights
- Index essentially flat over past six weeks
- Economic outlook slightly better, current conditions slightly worse
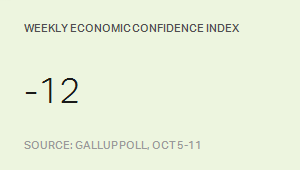
WASHINGTON, D.C. -- Gallup's U.S. Economic Confidence Index registered -12 for the week ending Oct. 11, essentially the same as the index scores between -12 and -14 over the past six weeks. The current reading is down from earlier this year, but about where it was one year ago.
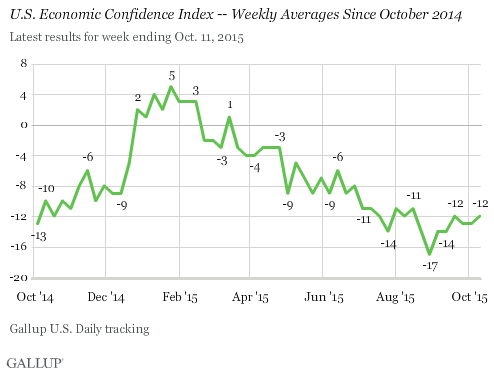
The index has been fairly stagnant in recent months. With the exception of an 11-month low of -17 in late August amid volatility in Chinese stocks, the index has remained within a narrow range of -11 to -14 since July. Scores were much higher in early 2015, including a brief period in positive territory, likely related to the steady decline in gas prices in late 2014 and early 2015. Still, the latest index reading is much higher than many of the scores recorded from 2008 to 2014.
Gallup's Economic Confidence Index is based on the combined responses to two questions: The first asks Americans to rate economic conditions in the U.S. today, and the second asks whether they think economic conditions in the country as a whole are getting better or getting worse. The index has a theoretical maximum of +100, if all Americans were to rate the economy as "excellent" or "good" and "getting better," and a theoretical minimum of -100, if all were to rate the economy as "poor" and "getting worse."
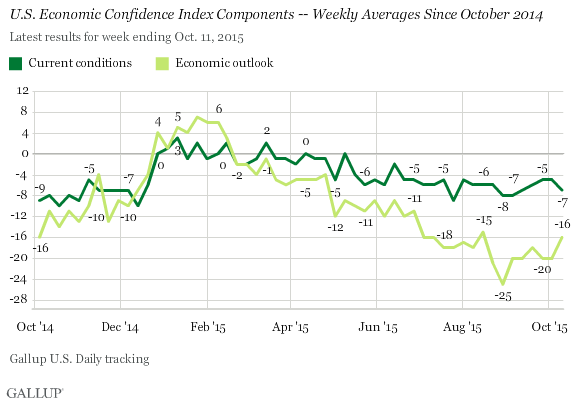
The stability in the overall index does obscure a slight decrease this past week in Americans' ratings of current economic conditions and a slight increase in their perceptions of the direction the economy is headed in. The current conditions score of -7 was slightly lower than the -5 and -6 scores found in the past few weeks. This is the result of 24% of Americans rating the economy as excellent or good and 31% saying it is poor.
Meanwhile, the economic outlook score of -16 -- based on 40% saying the economy is getting better and 56% getting worse -- was the highest for this component since August.
Bottom Line
While Americans' views of the U.S. economy's current state have barely moved in recent months, their views of its future -- which are generally more negative than the current conditions component -- have recovered quite a bit from their late August low. However, they still are not as positive as they were earlier this year.
Americans may be more optimistic about the economy's direction as gas prices are on the low end of what they have been all year, and the stock market recovers after plummeting over the summer.
These data are available in Gallup Analytics.
Survey Methods
Results for this Gallup poll are based on telephone interviews conducted Oct. 5-11, 2015, on the Gallup U.S. Daily survey, with a random sample of 3,038 adults, aged 18 and older, living in all 50 U.S. states and the District of Columbia. For results based on the total sample of national adults, the margin of sampling error is ±2 percentage points at the 95% confidence level. All reported margins of sampling error include computed design effects for weighting.
Each sample of national adults includes a minimum quota of 60% cellphone respondents and 40% landline respondents, with additional minimum quotas by time zone within region. Landline and cellular telephone numbers are selected using random-digit-dial methods.
Learn more about how Gallup Poll Social Series works.