Story Highlights
- Worldwide, 34% want immigration to decrease
- In Europe, 52% want lower immigration levels
- Not all Europeans feel the same
WASHINGTON, D.C. -- Well before the flow of migrants into Europe reached crisis proportions this year, a Gallup study of attitudes toward immigration in 142 countries found people in Europe, on average, were the most negative in the world toward immigration. The majority of residents (52%) said immigration levels in their countries should be decreased. In every other major region of the world, people were more likely to want immigration levels in their countries to either stay at their present level or to increase, rather than to decrease.
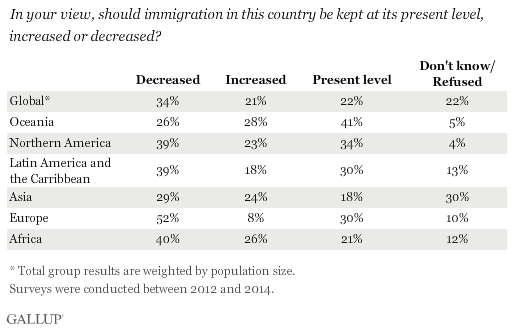
These findings are among those featured in the International Organization for Migration's new report, How the World Views Migration, which is based on Gallup World Poll interviews with more than 183,000 adults across 142 countries between 2012 and 2014. Adults worldwide were asked two questions about immigration: "In your view, should immigration in this country be kept at its present level, increased or decreased?" and "Do you think immigrants mostly take jobs that citizens in this country do not want (e.g., low-paying or not prestigious jobs), or mostly take jobs that citizens in this country want?"

Attitudes Toward Immigration Vary Throughout Europe
While Europe overall may be the most negative region in the world in regard to immigration levels, it's important to note that the regional average is largely affected by countries with large populations such as the United Kingdom and Russia, where 69% and 70% of their respective publics want immigration levels to decrease.
Britons and Russians are not alone in their attitudes, but they do not speak for all of Europe. Of the 40 countries included in the larger European region, residents in less than half (17 countries) are more likely to want immigration levels decreased than the other two options combined.
In fact, the majority of adults in nearly all of the 10 Northern European countries -- except the United Kingdom, Latvia and Lithuania -- would like the levels of immigration to stay the same or increase.
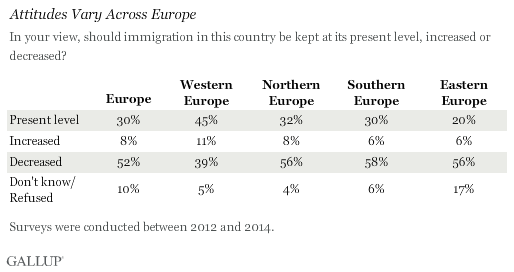
Elsewhere in Europe, sentiment is negative, if not more so, in many Mediterranean countries that historically have been the entry points to the continent for many migrants. In fact, adults in Greece -- one of the main countries of first arrival on the Eastern Mediterranean route -- are among the most likely in the world to want immigration levels decreased, with 84% expressing this view. This sentiment is shared by 56% of residents in Spain, 67% of those in Italy and 76% of those in Malta.
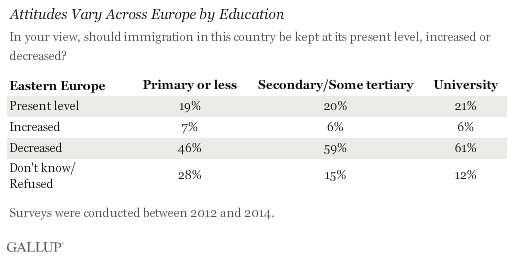
More Educated Europeans More Positive Toward Immigration
Negative and positive opinions toward immigration exist in every region and every country; however, certain characteristics are consistently associated with favorable or opposing attitudes toward immigration. The study finds that adults with a university degree are typically more likely than those with lower levels of education to want to see immigration kept at its present level or increased in their countries.
Generally, in Europe, those with the highest level of education (university degree) are more likely to be positive toward immigration than those with less education (secondary or lower education). However, among those with university degrees, opinions are divided, with 46% favoring increased or stable levels of immigration and an equal 46% favoring decreased immigration. In contrast, Europeans with secondary or lower education are solidly more likely to favor decreasing immigration than to favor increasing it or keeping it the same.
Europe is interesting because three different scenarios play out across the four major subregions and the profiles of those who are more positive or negative toward immigration look different. In Eastern Europe, for example, those with university degrees are more negative than those with primary education or lower. This is largely driven by attitudes in large countries such as Russia and Ukraine, as there are few differences in opinion by education in most of the other countries in the region. However, different dynamics are at play in these two countries.
Despite the economic stagnation in Russia during the global economic downturn, the reasons Russians want to see less immigration appear to have little to do with the economy. Russians mostly do not see migrants as competitors for their jobs: Majorities in the highest education groups (61% of respondents with university degrees and 55% of those with secondary education) say that migrants take jobs that regular citizens do not want, as do nearly half (47%) of those with primary or lower education.
In Ukraine, whose economy was in near ruins before the revolution in 2014, economics appears to be a factor in people's attitudes toward immigration. Only 26% in the most highly educated group say that migrants take jobs that citizens do not want. The majority say migrants take jobs that Ukrainians want or believe it is a mix of both situations. This indicates that many native citizens feel migrants are directly competing with them for jobs.
Implications
These findings, among many others presented in the new report, represent the first steps toward understanding the lenses through which people view immigration on a global level.
Looking at how most people in the world view immigration, rather than a particular region or a particular country, it appears that attitudes toward immigration are not as negative as often suggested. When the surveys were carried out, in every major region of the world, with the exception of Europe, people were more likely to want immigration levels in their countries to either stay at the present level or to increase, rather than to decrease.
At the same time, the results also reveal that negative and positive opinions toward immigration exist in every region and every country, illustrating the challenges that governments face in creating cohesive migration policies that align with their countries' needs and the public's desires.
Frank Laczko and Marzia Rango of IOM were contributing authors to the How the World Views Migration report.
Survey Methods
Gallup conducted a total of 183,772 interviews in 2012, 2013 and 2014. Most data for this report were collected in 2012 and 2013. In 2014, data were collected for Canada, Australia, Hong Kong, China, Switzerland and Norway. For this report, typically 1,000 interviews were done per country. A few countries such as India and China have higher sample sizes (more than 2,500 each), and all former Soviet Union countries included multiple survey administrations with a minimum of 1,000 interviews per administration.
With some exceptions, all country samples are probability based and nationally representative of the resident population aged 15 and older. The coverage area is the entire country including rural areas, and the sampling frame represents the entire civilian, non-institutionalized, aged 15 and older population of the country. Exceptions include areas where the safety of interviewing staff is threatened, scarcely populated islands in some countries and areas that interviewers can reach only by foot, animal or small boat. In Gulf Cooperation Council countries, at the time of data collection Gallup was able to interview only nationals and Arab expatriates.
Telephone surveys are used in countries where telephone coverage represents at least 80% of the population or is the customary survey methodology. In Central and Eastern Europe, as well as in the developing world, including much of Latin America, the former Soviet Union countries, nearly all of Asia, the Middle East and Africa, an area frame design is used for face-to-face interviewing.