Story Highlights
- Index has been stable for seven consecutive weeks
- Current averages lower than earlier in 2015
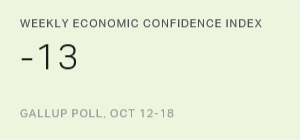
WASHINGTON, D.C. -- Gallup's Economic Confidence Index averaged -13 for the week ending Oct. 18. The index has been relatively flat since the week ending Sept. 6, holding between -12 and -14.
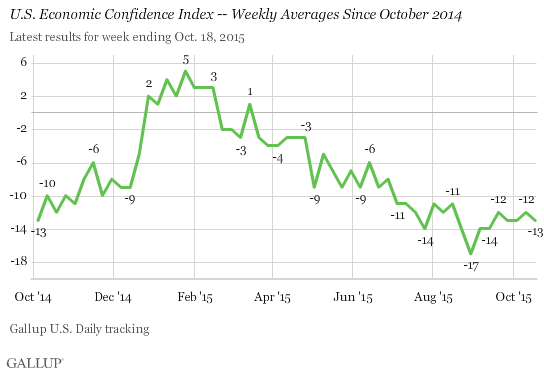
The Economic Confidence Index dropped in the last week of August to -17, its low point for the year so far, most likely reflecting the struggling international markets and volatility in the Chinese stock market. While the index has recovered, it remains lower than where it has been through most of 2015. The index had been above -10 from late November 2014 through early July 2015, including a high of +5 at the end of January. However, since early July, the index has been below -10.
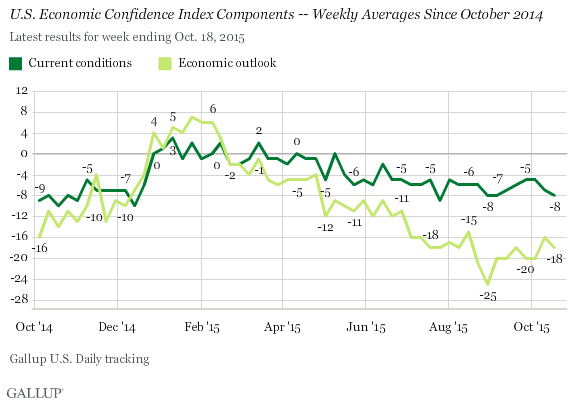
Gallup's Economic Confidence Index is the average of two components: how Americans rate current economic conditions and whether they say the economy is "getting better" or "getting worse." Although the two components usually move up and down together, since early March Americans have consistently viewed the outlook for the economy more negatively than they do current economic conditions.
For the week ending Oct. 18, 23% of Americans rated current economic conditions as "excellent" or "good," while 31% rated them as "poor." This resulted in a current conditions score of -8, level with recent weeks.
The economic outlook score was -18, also similar to recent weeks. This was the result of 39% of Americans saying the economy is getting better and 57% saying it is getting worse.
While Gallup's Economic Confidence Index has been steady recently, it remains significantly worse than it was over the first half of the year. Nevertheless, recent averages remain much higher compared with a few years ago during the Great Recession and its immediate aftermath.
These data are available in Gallup Analytics.
Survey Methods
Results for this Gallup poll are based on telephone interviews conducted Oct. 12-18, 2015, on the Gallup U.S. Daily survey, with a random sample of 3,547 adults, aged 18 and older, living in all 50 U.S. states and the District of Columbia. For results based on the total sample of national adults, the margin of sampling error is ±2 percentage points at the 95% confidence level. All reported margins of sampling error include computed design effects for weighting.
Each sample of national adults includes a minimum quota of 60% cellphone respondents and 40% landline respondents, with additional minimum quotas by time zone within region. Landline and cellular telephone numbers are selected using random-digit-dial methods.
Learn more about how the Gallup U.S. Daily works.