Story Highlights
- Index consistent with recent weekly scores
- Economic outlook component up slightly, at -17
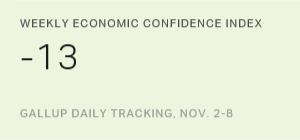
WASHINGTON, D.C. -- Americans' confidence in the U.S. economy remains more negative than positive, with Gallup's Economic Confidence Index at -13 for the week ending Nov. 8. This is within the range of readings between -11 and -17 that Gallup has recorded since July.
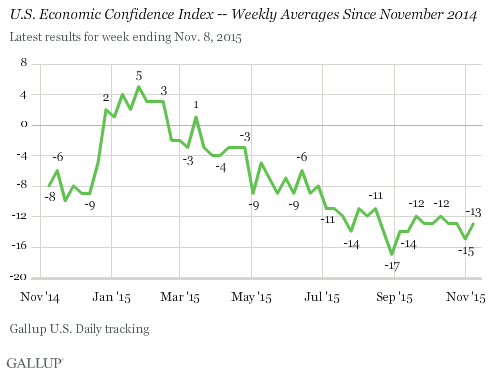
Though the index is significantly lower than it was early in 2015, the pattern into which confidence appears to have settled is still much better than it was for most of 2008 to 2012, when the annual index scores ranged between -21 and -48.
Gallup's Economic Confidence Index is based on the combined responses to two questions: The first asks Americans to rate economic conditions in the U.S. today, and the second asks whether they think economic conditions in the country as a whole are getting better or getting worse. The index has a theoretical maximum of +100, if all Americans were to rate the economy as "excellent" or "good" and "getting better," and a theoretical minimum of -100, if all were to rate the economy as "poor" and "getting worse."
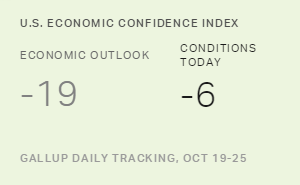
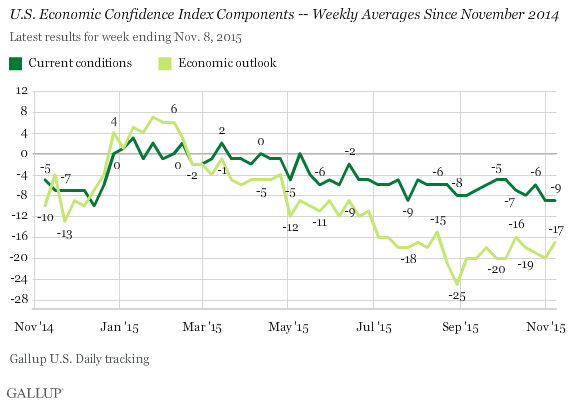
Americans have been more positive in their evaluations of current economic conditions than about the direction of the economy for much of the year, and that holds true today. For the week ending Nov. 8, the current conditions score was -9 (reflecting 22% of Americans rating the economy excellent or good versus 31% poor). Although not dramatically different from other readings this year, the current conditions score does represent the 2015 low point. Meanwhile, last week's economic outlook score is a bit better than most weekly readings since August; that score was -17 (based on 39% saying the economy is getting better and 56% getting worse).
These data are available in Gallup Analytics.
Survey Methods
Results for this Gallup poll are based on telephone interviews conducted Nov. 2-8, 2015, on the Gallup U.S. Daily survey, with a random sample of 3,548 adults, aged 18 and older, living in all 50 U.S. states and the District of Columbia. For results based on the total sample of national adults, the margin of sampling error is ±2 percentage points at the 95% confidence level. All reported margins of sampling error include computed design effects for weighting.
Each sample of national adults includes a minimum quota of 60% cellphone respondents and 40% landline respondents, with additional minimum quotas by time zone within region. Landline and cellular telephone numbers are selected using random-digit-dial methods.
Learn more about how Gallup Daily tracking works.