Story Highlights
- Dec. 2015 Gallup Good Jobs a full point higher year-on-year
- Unemployment lowest Gallup has measured since Jan. 2010
- Underemployment falls to 14.0%
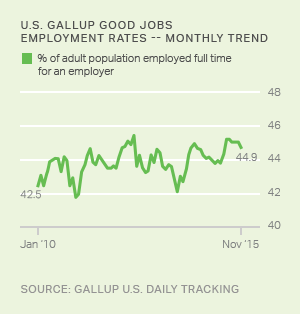
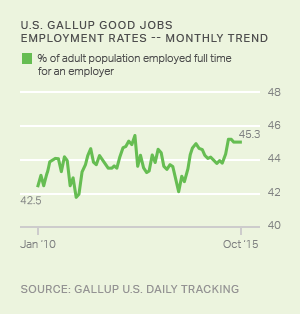
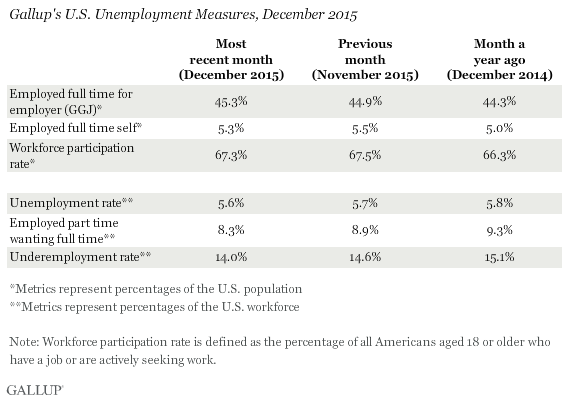
WASHINGTON, D.C. -- The Gallup Good Jobs (GGJ) rate in the U.S. was 45.3% in December. This is up slightly from the rate measured in November (44.9%) and even with the rate measured from August through October. Given seasonal patterns in employment, it is notable that the current rate is a full percentage point higher than in December 2014.
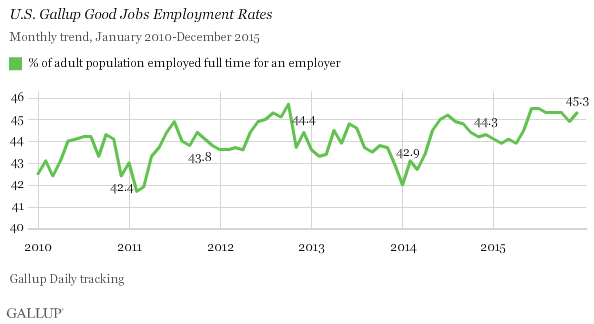
The GGJ metric tracks the percentage of the U.S. adult population, aged 18 and older, who work for an employer full time -- at least 30 hours per week. Gallup does not count adults who are self-employed, work fewer than 30 hours per week, are unemployed or are out of the workforce as payroll-employed in the GGJ metric.
The latest results are based on Gallup Daily tracking interviews Dec. 1-30, 2015, with 27,350 Americans. GGJ is not seasonally adjusted.
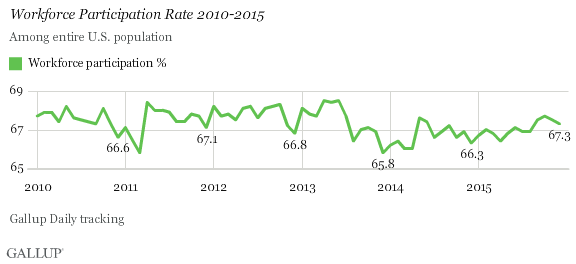
Workforce Participation at 67.3% in December
The percentage of U.S. adults in December who were participating in the workforce by working full time, working part time or actively seeking and being available for work was 67.3%. This is down only slightly from the rate in November (67.5%). Gallup's workforce participation measure averaged 67.7% between January 2010 and June 2013, but since then has averaged about one point lower, at 66.9%. Higher participation rates in the past several months may signal returning strength in the labor market.
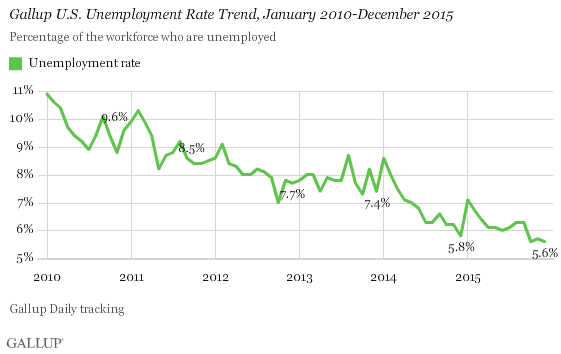
Unemployment at 5.6%
Gallup's unadjusted U.S. unemployment rate was 5.6% in December, essentially unchanged from November's 5.7% and tied with October 2015 for the lowest in any month since Gallup began tracking the measure in 2010. The unemployment rate in December 2014 was 5.8%. Gallup's U.S. unemployment rate represents the percentage of adults in the workforce who did not have any paid work in the past seven days, either for an employer or themselves, and who were actively looking for and available to work.
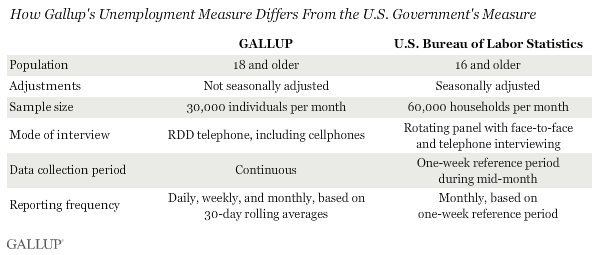
Unlike Gallup's GGJ rate, which is a percentage of the total population, the unemployment rates that Gallup and the U.S. Bureau of Labor Statistics (BLS) report are percentages of the labor force. While both Gallup and BLS data are based on surveys with large sample sizes, the two have important methodological differences -- outlined at the end of this article. Additionally, the most discussed unemployment rate released by the BLS each month is seasonally adjusted, while Gallup reports unadjusted numbers. Although Gallup's unemployment numbers strongly correlate with BLS rates, the BLS and Gallup estimates of unemployment do not always track precisely on a monthly basis.
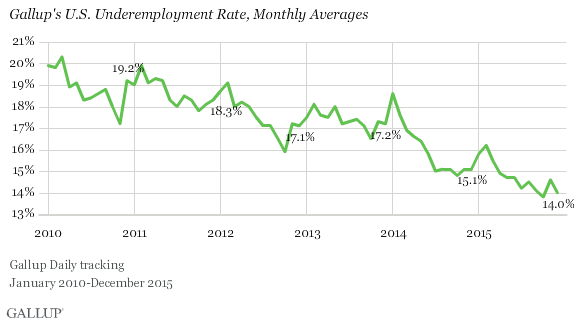
Underemployment Falls to 14.0%
Gallup's measure of underemployment in December was 14.0%, down 0.6 points from November and in line with the rates measured in October (13.8%) and September (14.1%). Gallup's U.S. underemployment rate combines the percentage of adults in the workforce who are unemployed (5.6%) with those who are working part time but desire full-time work (8.3%); these figures total 14.0% due to rounding.
Unemployment has been almost unchanged since October, but the percentage of "involuntary" part-time workers rose by 0.7 points in November before falling back 0.6 points in December. The current involuntary part-time rate is down a full point from December 2014 (9.3%). However, involuntary part-time employment has been relatively constant over the past six years, never registering more than 10.1% but only once falling below 8.0%.
Bottom Line
Gallup's labor market indicators in December ended the year on a high note, as full-time employment for an employer remained higher year-on-year while unemployment and underemployment were lower. This overall picture of increasing strength in the U.S. labor market has been mirrored in official government statistics, prompting the U.S. Federal Reserve to raise interest rates for the first time in nine years this past month. As the new year begins, the U.S. labor market continues to slowly grow stronger.
The data in this article are available in Gallup Analytics.
Gallup.com reports results from these indexes in daily, weekly and monthly averages and in Gallup.com stories. Complete trend data are always available to view in the following charts:
Daily: Employment, Economic Confidence and Job Creation, Consumer Spending
Weekly: Employment, Economic Confidence, Job Creation, Consumer Spending
Read more about Gallup's economic measures.
View our economic release schedule.
Survey Methods
Results for this Gallup poll are based on telephone interviews conducted Dec. 1-30, 2015, on the Gallup U.S. Daily survey, with a random sample of 27,350 adults, aged 18 and older, living in all 50 U.S. states and the District of Columbia. For results based on the total sample of national adults, the margin of sampling error is ±1 percentage point at the 95% confidence level. All reported margins of sampling error include computed design effects for weighting.
Each sample of national adults includes a minimum quota of 60% cellphone respondents and 40% landline respondents, with additional minimum quotas by time zone within region. Landline and cellular telephone numbers are selected using random-digit-dial methods.
Learn more about how the Gallup U.S. Daily works.