Story Highlights
- Index has been between -10 and -15 since September 2015
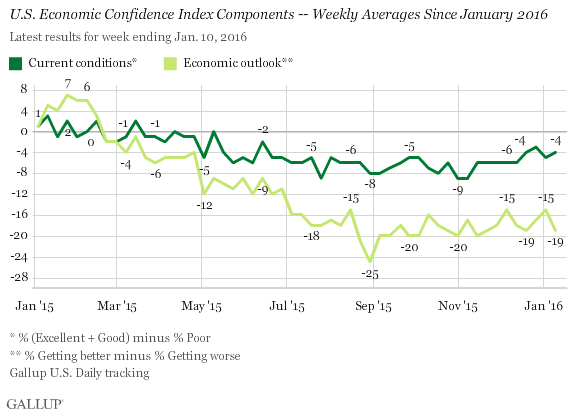
- Economic outlook still rated worse than current conditions
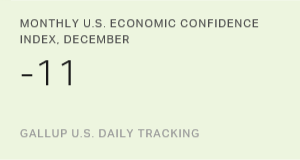
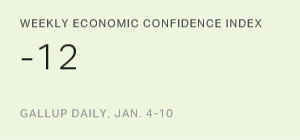
WASHINGTON, D.C. -- Gallup's U.S. Economic Confidence Index measured -12 for the week ending Jan. 10. This is similar to what Gallup has found over the past several months.
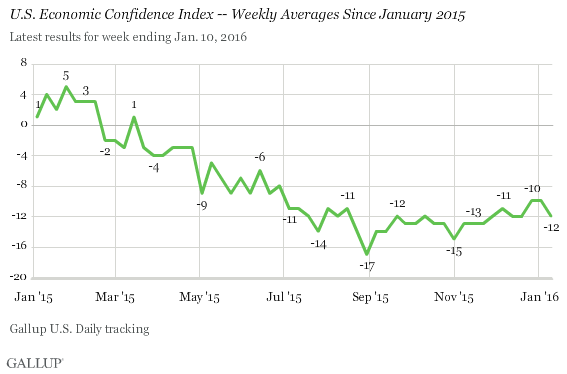
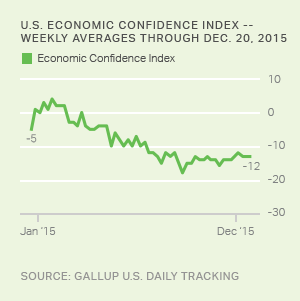
Last January, the Economic Confidence Index was in positive territory, including a score of +5 for the week of Jan. 19-25 -- the highest weekly average Gallup had found since 2008. However, confidence began to diminish shortly afterward, and Gallup's index has not been in positive territory since March. More recently, weekly averages have stayed consistently within a narrow range of -10 to -15 since September. The most recent weekly average of -12 falls in the middle of that six-point range.
Gallup's Economic Confidence Index is the average of two components: how Americans rate current economic conditions and whether they feel the economy is getting better or getting worse. The index has a theoretical maximum of +100 if all U.S. adults say the economy is doing well and getting better, and it has a theoretical minimum of -100 if all U.S. adults say the economy is doing poorly and getting worse.
For the week ending Jan. 10, 25% of adults said the current economy is "excellent" or "good," while 29% said it is "poor." This resulted in a current conditions score of -4, consistent with what has been found in recent weeks.
The economic outlook score measured -19 for the week, also level with recent scores. This was the result of 39% of Americans saying the economy is "getting better" and 58% saying it is "getting worse." Since March 2015, Americans have consistently had a worse view of the outlook for the economy than of current economic conditions.
Bottom Line
Amid the mixed economic news last week, Americans' evaluations of the national economy remained essentially unchanged. On the negative side, the U.S. stock market had a tumultuous first full week of 2016, dropping in response to the Chinese stock market and lower oil prices. This led to the worst recorded start of the year for major U.S. stock indexes. But there was a significant positive counterweight in the U.S. Labor Department's report on U.S. employment, which showed relatively strong job gains in December in addition to upward revisions in the October and November data.
These data are available in Gallup Analytics.
Survey Methods
Results for this Gallup poll are based on telephone interviews conducted Jan. 4-10, 2016, on the Gallup U.S. Daily survey, with a random sample of 3,543 adults, aged 18 and older, living in all 50 U.S. states and the District of Columbia. For results based on the total sample of national adults, the margin of sampling error is ±2 percentage points at the 95% confidence level. All reported margins of sampling error include computed design effects for weighting.
Each sample of national adults includes a minimum quota of 60% cellphone respondents and 40% landline respondents, with additional minimum quotas by time zone within region. Landline and cellular telephone numbers are selected using random-digit-dial methods.
Learn more about how the Gallup U.S. Daily works.