Story Highlights
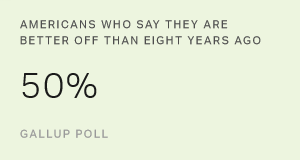
- Fifty percent say they are better off than eight years ago
- More than twice as many Dems as Republicans feel better off
- Americans also split into the savers and non-savers
PRINCETON, N.J. -- As Americans evaluate the various economic messages from the 2016 presidential aspirants, they do so with divergent perspectives on their own economic situation. Half of U.S. adults believe they are better off than they were eight years ago, while 42% say they are not. This is in marked contrast to January 2000 when three in four adults agreed they were better off.
| Yes, better off% | No, not better off% | Just as well off (vol.)% | No opinion% | ||||||||||||||||||||||||||||||||||||||||||||||||||||||||||||||||||||||||||||||||||||||||||||||||
|---|---|---|---|---|---|---|---|---|---|---|---|---|---|---|---|---|---|---|---|---|---|---|---|---|---|---|---|---|---|---|---|---|---|---|---|---|---|---|---|---|---|---|---|---|---|---|---|---|---|---|---|---|---|---|---|---|---|---|---|---|---|---|---|---|---|---|---|---|---|---|---|---|---|---|---|---|---|---|---|---|---|---|---|---|---|---|---|---|---|---|---|---|---|---|---|---|---|---|---|
| Jan 21-25, 2016 | 50 | 42 | 6 | 2 | |||||||||||||||||||||||||||||||||||||||||||||||||||||||||||||||||||||||||||||||||||||||||||||||
| Jan 7-10, 2000 | 73 | 19 | 7 | 1 | |||||||||||||||||||||||||||||||||||||||||||||||||||||||||||||||||||||||||||||||||||||||||||||||
| Note: (vol.) = Volunteered response | |||||||||||||||||||||||||||||||||||||||||||||||||||||||||||||||||||||||||||||||||||||||||||||||||||
| GALLUP | |||||||||||||||||||||||||||||||||||||||||||||||||||||||||||||||||||||||||||||||||||||||||||||||||||
Given the political undertones of this question -- with the answer implicitly reflecting on President Barack Obama's tenure in office -- most Democrats, including independents who lean Democratic, are nearly as upbeat as they were at the end of Bill Clinton's presidency in 2000. At the same time, most Republicans and Republican leaners currently deny that their lot has improved. However, in spite of the fact that the White House had been in Democratic control for almost all of the preceding eight years, their answers in 2000 were largely positive, indicating that unambiguously good economic times, as was the case in 2000, can override partisanship on this measure.
| Yes, better off% |
No, not better off% |
Just as well off (vol.)% |
No opinion% |
||||||||||||||||||||||||||||||||||||||||||||||||||||||||||||||||||||||||||||||||||||||||||||||||
|---|---|---|---|---|---|---|---|---|---|---|---|---|---|---|---|---|---|---|---|---|---|---|---|---|---|---|---|---|---|---|---|---|---|---|---|---|---|---|---|---|---|---|---|---|---|---|---|---|---|---|---|---|---|---|---|---|---|---|---|---|---|---|---|---|---|---|---|---|---|---|---|---|---|---|---|---|---|---|---|---|---|---|---|---|---|---|---|---|---|---|---|---|---|---|---|---|---|---|---|
| Jan 21-25, 2016 | |||||||||||||||||||||||||||||||||||||||||||||||||||||||||||||||||||||||||||||||||||||||||||||||||||
| Republican/Lean Republican | 29 | 66 | 4 | 1 | |||||||||||||||||||||||||||||||||||||||||||||||||||||||||||||||||||||||||||||||||||||||||||||||
| Democrat/Lean Democratic | 71 | 21 | 6 | 3 | |||||||||||||||||||||||||||||||||||||||||||||||||||||||||||||||||||||||||||||||||||||||||||||||
| Jan 7-10, 2000 | |||||||||||||||||||||||||||||||||||||||||||||||||||||||||||||||||||||||||||||||||||||||||||||||||||
| Republican/Lean Republican | 65 | 25 | 8 | 2 | |||||||||||||||||||||||||||||||||||||||||||||||||||||||||||||||||||||||||||||||||||||||||||||||
| Democrat/Lean Democratic | 81 | 13 | 5 | 1 | |||||||||||||||||||||||||||||||||||||||||||||||||||||||||||||||||||||||||||||||||||||||||||||||
| Note: (vol.) = Volunteered response | |||||||||||||||||||||||||||||||||||||||||||||||||||||||||||||||||||||||||||||||||||||||||||||||||||
| GALLUP | |||||||||||||||||||||||||||||||||||||||||||||||||||||||||||||||||||||||||||||||||||||||||||||||||||
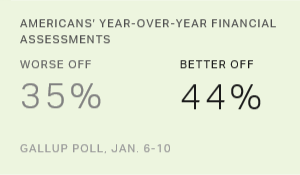
These findings are from Gallup's Jan. 21-25 Election Benchmark survey, conducted with 1,022 U.S. adults. Americans' split assessment of their financial position is similar to a Gallup finding earlier this month in which 44% said they are better off financially than a year ago, 35% said they are worse off, and 21% said they are about the same.
Older Republicans Are Especially Discouraged
Beyond politics, age is a major factor in Republicans' views of their economic progress. Fifty-three percent of Republicans under age 45 say they are better off than eight years ago, but this drops by more than half to 20% among those aged 45 to 64, and falls further to 15% among those 65 and older. A whopping 82% of Republican seniors say they are not better off.
Age is less of a factor among Democrats, with the percentage saying they are better off ranging from 78% of the youngest age category to 56% of seniors.
| 18 to 44% | 45 to 64% | 65 and older% | |||||||||||||||||||||||||||||||||||||||||||||||||||||||||||||||||||||||||||||||||||||||||||||||||
|---|---|---|---|---|---|---|---|---|---|---|---|---|---|---|---|---|---|---|---|---|---|---|---|---|---|---|---|---|---|---|---|---|---|---|---|---|---|---|---|---|---|---|---|---|---|---|---|---|---|---|---|---|---|---|---|---|---|---|---|---|---|---|---|---|---|---|---|---|---|---|---|---|---|---|---|---|---|---|---|---|---|---|---|---|---|---|---|---|---|---|---|---|---|---|---|---|---|---|---|
| Republican/Lean Republican | |||||||||||||||||||||||||||||||||||||||||||||||||||||||||||||||||||||||||||||||||||||||||||||||||||
| Yes, better off | 53 | 20 | 15 | ||||||||||||||||||||||||||||||||||||||||||||||||||||||||||||||||||||||||||||||||||||||||||||||||
| No, not better off | 40 | 76 | 82 | ||||||||||||||||||||||||||||||||||||||||||||||||||||||||||||||||||||||||||||||||||||||||||||||||
| Just as well off (vol.) | 4 | 4 | 3 | ||||||||||||||||||||||||||||||||||||||||||||||||||||||||||||||||||||||||||||||||||||||||||||||||
| No opinion | 2 | * | * | ||||||||||||||||||||||||||||||||||||||||||||||||||||||||||||||||||||||||||||||||||||||||||||||||
| Democrat/Lean Democratic | |||||||||||||||||||||||||||||||||||||||||||||||||||||||||||||||||||||||||||||||||||||||||||||||||||
| Yes, better off | 78 | 69 | 56 | ||||||||||||||||||||||||||||||||||||||||||||||||||||||||||||||||||||||||||||||||||||||||||||||||
| No, not better off | 15 | 26 | 28 | ||||||||||||||||||||||||||||||||||||||||||||||||||||||||||||||||||||||||||||||||||||||||||||||||
| Just as well off (vol.) | 3 | 5 | 14 | ||||||||||||||||||||||||||||||||||||||||||||||||||||||||||||||||||||||||||||||||||||||||||||||||
| No opinion | 5 | * | 2 | ||||||||||||||||||||||||||||||||||||||||||||||||||||||||||||||||||||||||||||||||||||||||||||||||
| Note: (vol.) = Volunteered response | * Less than 0.5% | Jan. 21-25, 2016 | |||||||||||||||||||||||||||||||||||||||||||||||||||||||||||||||||||||||||||||||||||||||||||||||||||
| Gallup | |||||||||||||||||||||||||||||||||||||||||||||||||||||||||||||||||||||||||||||||||||||||||||||||||||
While these results provide a framework for understanding the mood of Republicans and Democrats as they contemplate which candidate to support in the primaries, another question in the new poll offers a more concrete perspective on Americans' finances, but with similar results.
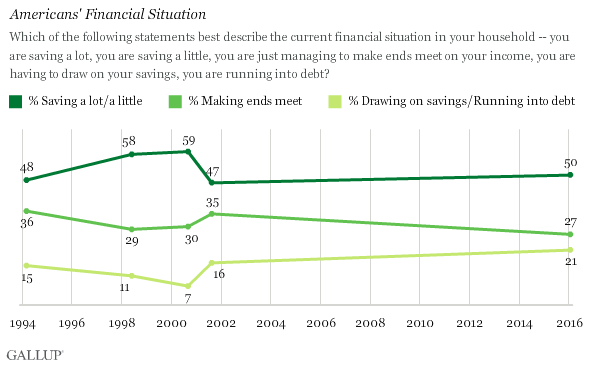
When asked about their current finances, half of Americans report doing well enough to be saving either a lot of money (13%) or a little (37%). At the same time, just under half fall into one of the "not better off" categories: 27% say they are just managing to make ends meet while 21% are in the red, either having to draw on savings (8%) or running into debt (13%).
In contrast to the measure of the past eight years, there is virtually no difference between Republicans and Democrats on this question.
| U.S. adults% | Republican/Lean Republican% | Democrat/Lean Democratic% | |||||||||||||||||||||||||||||||||||||||||||||||||||||||||||||||||||||||||||||||||||||||||||||||||
|---|---|---|---|---|---|---|---|---|---|---|---|---|---|---|---|---|---|---|---|---|---|---|---|---|---|---|---|---|---|---|---|---|---|---|---|---|---|---|---|---|---|---|---|---|---|---|---|---|---|---|---|---|---|---|---|---|---|---|---|---|---|---|---|---|---|---|---|---|---|---|---|---|---|---|---|---|---|---|---|---|---|---|---|---|---|---|---|---|---|---|---|---|---|---|---|---|---|---|---|
| Saving a lot | 13 | 13 | 14 | ||||||||||||||||||||||||||||||||||||||||||||||||||||||||||||||||||||||||||||||||||||||||||||||||
| Saving a little | 37 | 38 | 37 | ||||||||||||||||||||||||||||||||||||||||||||||||||||||||||||||||||||||||||||||||||||||||||||||||
| Making ends meet | 27 | 26 | 28 | ||||||||||||||||||||||||||||||||||||||||||||||||||||||||||||||||||||||||||||||||||||||||||||||||
| Drawing on savings | 8 | 9 | 7 | ||||||||||||||||||||||||||||||||||||||||||||||||||||||||||||||||||||||||||||||||||||||||||||||||
| Running into debt | 13 | 12 | 12 | ||||||||||||||||||||||||||||||||||||||||||||||||||||||||||||||||||||||||||||||||||||||||||||||||
| Total saving | 50 | 51 | 51 | ||||||||||||||||||||||||||||||||||||||||||||||||||||||||||||||||||||||||||||||||||||||||||||||||
| Total not saving | 48 | 47 | 47 | ||||||||||||||||||||||||||||||||||||||||||||||||||||||||||||||||||||||||||||||||||||||||||||||||
| Jan. 21-25, 2016 | |||||||||||||||||||||||||||||||||||||||||||||||||||||||||||||||||||||||||||||||||||||||||||||||||||
| GALLUP | |||||||||||||||||||||||||||||||||||||||||||||||||||||||||||||||||||||||||||||||||||||||||||||||||||
Also, in Gallup's limited trend on this measure, the percentage able to save is on the low end while the percentage falling behind -- either drawing on savings or running into debt -- is the highest recorded. These figures were undoubtedly worse in the recent recession years missing from the trend, but it is still clear that Americans' financial circumstances have been better.
Bottom Line
Whichever way one looks at it -- politically or in financial terms -- the U.S. divides into two broad economic groups. One is upbeat or appearing to be thriving financially; the other is downbeat or financially struggling. Republicans -- and particularly the middle-aged and older Republicans who are most likely to vote in the upcoming primaries -- show high economic anxiety on both measures, possibly helping to explain the Republican front-runner's success with his "Make America Great Again" campaign theme. And while Democrats are willing to say they are better off than eight years ago, the fact that nearly half are barely getting by financially means the Democratic candidates cannot ignore the issues holding people back economically.
Historical data are available in Gallup Analytics.
Survey Methods
Results for this Gallup poll are based on telephone interviews conducted Jan. 21-25, 2016, with a random sample of 1,022 adults, aged 18 and older, living in all 50 U.S. states and the District of Columbia. For results based on the total sample of national adults, the margin of sampling error is ±4 percentage points at the 95% confidence level. All reported margins of sampling error include computed design effects for weighting.
Each sample of national adults includes a minimum quota of 60% cellphone respondents and 40% landline respondents, with additional minimum quotas by time zone within region. Landline and cellular telephone numbers are selected using random-digit-dial methods.
Learn more about how Gallup Poll Social Series works.