Story Highlights
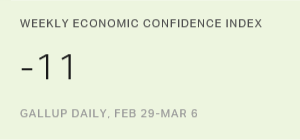
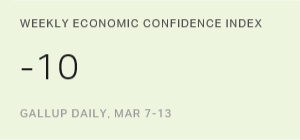
- Index score similar to prior week's -11
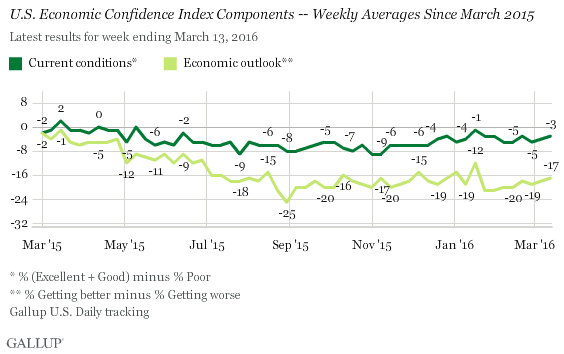
- Current conditions, economic outlook scores each up a point
WASHINGTON, D.C. -- Gallup's U.S. Economic Confidence Index was -10 for the week ending March 13. This score is similar to the -11 recorded during the first week of the month, and is generally similar to most weekly confidence levels so far this year.
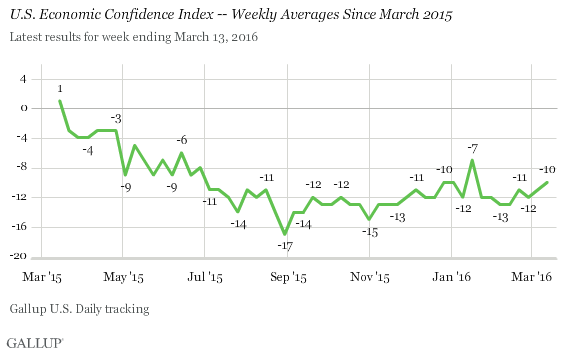
Americans' current level of confidence in the national economy is a good deal lower than where it was a year ago, when the index score of +1 represented a more positive view of the economy's health. Weekly scores became more negative in the five months that followed, bottoming out at -17 in August. Since then, the index has ranged from -10 to -15 -- with a single exception of a -7 weekly average in mid-January.
Gallup's U.S. Economic Confidence Index is the average of two components: how U.S. adults rate current economic conditions and whether they believe the economy is getting better or getting worse. The theoretical maximum of the index is +100 if all Americans rate the economy well and say it is getting better, and it has a theoretical minimum of -100 if all U.S. adults rate the economy poorly and say it is getting worse.
For the week ending March 13, 25% of U.S. adults rated the current economy "excellent" or "good," while 28% rated it "poor." This resulted in a current conditions score of -3, remaining similar to this component's scores since mid-January. Meanwhile, the economic outlook score was -17, compared with scores between -18 and -21 since mid-January. This was the result of 39% of U.S. adults saying the economy is "getting better" and 56% saying it is "getting worse."
These data are available in Gallup Analytics.
Survey Methods
Results for this Gallup poll are based on telephone interviews conducted March 7-13, 2016, on the Gallup U.S. Daily survey, with a random sample of 3,554 adults, aged 18 and older, living in all 50 U.S. states and the District of Columbia. For results based on the total sample of national adults, the margin of sampling error is ±2 percentage points at the 95% confidence level. All reported margins of sampling error include computed design effects for weighting.
Each sample of national adults includes a minimum quota of 60% cellphone respondents and 40% landline respondents, with additional minimum quotas by time zone within region. Landline and cellular telephone numbers are selected using random-digit-dial methods.
Learn more about how Gallup Daily tracking works.