Story Highlights
- Highest Gallup Good Jobs rate in any March since 2010
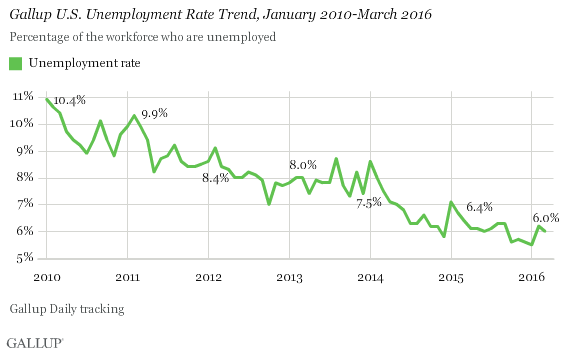
- Seasonally unadjusted unemployment down slightly to 6.0%
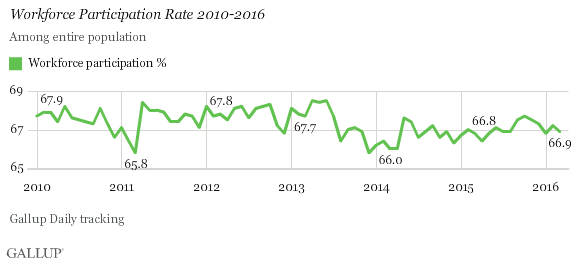
- Workforce participation slips 0.3 percentage points to 66.9%
Editor's Note: An earlier version of this story has been amended to reflect updated data.
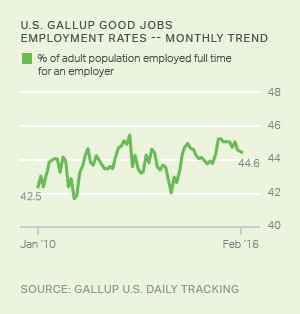
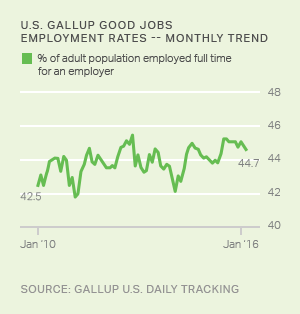
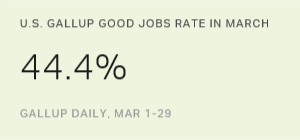
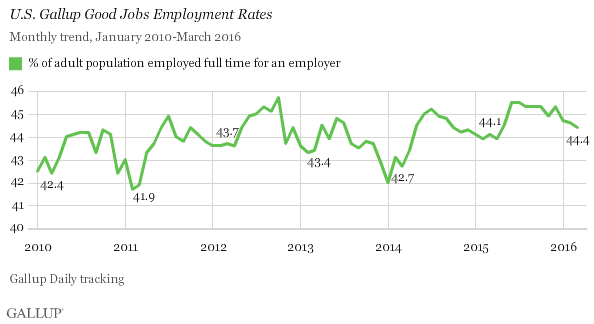
WASHINGTON, D.C. -- The Gallup Good Jobs (GGJ) rate in the U.S. was 44.4% in March. This is down nominally from the February rate (44.6%) but higher than the rate in any March since Gallup began measuring it in 2010. The current rate is 0.3 percentage points higher than in March 2015, suggesting an underlying increase in full-time work beyond seasonal changes in employment.
The GGJ metric tracks the percentage of U.S. adults, aged 18 and older, who work for an employer full time -- at least 30 hours per week. Gallup does not count adults who are self-employed, work fewer than 30 hours per week, are unemployed or are out of the workforce as payroll-employed in the GGJ metric.
The latest results are based on Gallup Daily tracking interviews with 30,469 U.S. adults, conducted March 1-31 by landline telephone and cellphone. GGJ is not seasonally adjusted.
Workforce Participation at 66.9% in March
The percentage of U.S. adults in March who participated in the workforce -- by working full time, part time or not working but actively seeking and being available for work -- was 66.9%. This is down slightly from the rate in February (67.2%) and even with the 66.9% average workforce participation rate since June 2013. From February 2010 to June 2013, it had been almost a point higher, averaging 67.7%.
Unemployment at 6.0%
Gallup's unadjusted U.S. unemployment rate was 6.0% in March, down slightly from February's 6.2%. It is the lowest rate in any March since Gallup began tracking the measure in 2010, including last year's 6.4%. Gallup's U.S. unemployment rate represents the percentage of adults in the workforce who did not have any paid work in the past seven days, either for an employer or for themselves, and who were actively looking for and available to work.
Unlike Gallup's GGJ rate, which is a percentage of the total population, the unemployment rates that Gallup and the U.S. Bureau of Labor Statistics (BLS) report are percentages of the labor force. While both Gallup and BLS data are based on surveys with large sample sizes, the two have important methodological differences -- outlined at the end of this article. Additionally, the most-discussed unemployment rate released by the BLS each month is seasonally adjusted, while Gallup reports unadjusted numbers. Although Gallup's unemployment numbers strongly correlate with BLS rates, the BLS and Gallup estimates of unemployment do not always track precisely on a monthly basis.
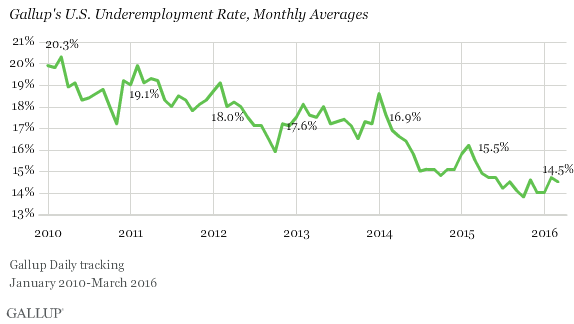
Underemployment Steady at 14.5%
Gallup's measure of underemployment in March was 14.5%, also down slightly from February (14.7%) but in line with the rates since April 2015. Gallup's U.S. underemployment rate combines the percentage of adults in the workforce who are unemployed (6.0%) with those who are working part time but desire full-time work (8.5%). Underemployment rates were much higher from 2010 through June 2014 than they have been since. The current underemployment rate of 14.5% is the lowest Gallup has measured in any March over the past seven years.
Bottom Line
Despite the nominal changes in GGJ and unemployment, the U.S. labor market situation in March is similar to a month ago. GGJ is typically near its lowest annual levels each March. However, GGJ remains the same or higher year-on-year as it has each month since May 2014, suggesting an overall strengthening of full-time labor market conditions.
The coming months will tell whether this represents a slackening in labor demand that had been picking up steam last year or a conservation of those gains during a season that usually sees higher unemployment and lower rates of full-time work.
The data in this article are available in Gallup Analytics.
| Most recent month (March 2016)% | Previous month (February 2016)% | Month a year ago (March 2015)% | |||||||||||||||||||||||||||||||||||||||||||||||||||||||||||||||||||||||||||||||||||||||||||||||||
|---|---|---|---|---|---|---|---|---|---|---|---|---|---|---|---|---|---|---|---|---|---|---|---|---|---|---|---|---|---|---|---|---|---|---|---|---|---|---|---|---|---|---|---|---|---|---|---|---|---|---|---|---|---|---|---|---|---|---|---|---|---|---|---|---|---|---|---|---|---|---|---|---|---|---|---|---|---|---|---|---|---|---|---|---|---|---|---|---|---|---|---|---|---|---|---|---|---|---|---|
| Employed full time for employer (GGJ)* | 44.4 | 44.6 | 44.1 | ||||||||||||||||||||||||||||||||||||||||||||||||||||||||||||||||||||||||||||||||||||||||||||||||
| Employed full time for self* | 5.6 | 5.5 | 5.3 | ||||||||||||||||||||||||||||||||||||||||||||||||||||||||||||||||||||||||||||||||||||||||||||||||
| Workforce participation rate* | 66.9 | 67.2 | 66.8 | ||||||||||||||||||||||||||||||||||||||||||||||||||||||||||||||||||||||||||||||||||||||||||||||||
| Unemployment rate** | 6.0 | 6.2 | 6.4 | ||||||||||||||||||||||||||||||||||||||||||||||||||||||||||||||||||||||||||||||||||||||||||||||||
| Employed part time, want full time** | 8.5 | 8.5 | 9.1 | ||||||||||||||||||||||||||||||||||||||||||||||||||||||||||||||||||||||||||||||||||||||||||||||||
| Underemployment rate** | 14.5 | 14.7 | 15.5 | ||||||||||||||||||||||||||||||||||||||||||||||||||||||||||||||||||||||||||||||||||||||||||||||||
| *Metrics represent percentages of the U.S. population aged 18 or older who have a job or are actively seeking work. | |||||||||||||||||||||||||||||||||||||||||||||||||||||||||||||||||||||||||||||||||||||||||||||||||||
| Gallup U.S. Daily tracking; **Metrics represent percentages of the U.S. workforce. | |||||||||||||||||||||||||||||||||||||||||||||||||||||||||||||||||||||||||||||||||||||||||||||||||||
| GALLUP | U.S. Bureau of Labor Statistics | ||||||||||||||||||||||||||||||||||||||||||||||||||||||||||||||||||||||||||||||||||||||||||||||||||
|---|---|---|---|---|---|---|---|---|---|---|---|---|---|---|---|---|---|---|---|---|---|---|---|---|---|---|---|---|---|---|---|---|---|---|---|---|---|---|---|---|---|---|---|---|---|---|---|---|---|---|---|---|---|---|---|---|---|---|---|---|---|---|---|---|---|---|---|---|---|---|---|---|---|---|---|---|---|---|---|---|---|---|---|---|---|---|---|---|---|---|---|---|---|---|---|---|---|---|---|
| Population | 18 and older | 16 and older | |||||||||||||||||||||||||||||||||||||||||||||||||||||||||||||||||||||||||||||||||||||||||||||||||
| Adjustments | Not seasonally adjusted | Seasonally adjusted | |||||||||||||||||||||||||||||||||||||||||||||||||||||||||||||||||||||||||||||||||||||||||||||||||
| Sample size | 30,000 individuals per month | 60,000 households per month | |||||||||||||||||||||||||||||||||||||||||||||||||||||||||||||||||||||||||||||||||||||||||||||||||
| Mode of interview | RDD telephone, including cellphones | Rotating panel with face-to-face and telephone interviewing | |||||||||||||||||||||||||||||||||||||||||||||||||||||||||||||||||||||||||||||||||||||||||||||||||
| Data collection period | Continuous | One-week reference period during mid-month | |||||||||||||||||||||||||||||||||||||||||||||||||||||||||||||||||||||||||||||||||||||||||||||||||
| Reporting frequency | Daily, weekly and monthly, based on 30-day rolling averages | Monthly, based on one-week reference period | |||||||||||||||||||||||||||||||||||||||||||||||||||||||||||||||||||||||||||||||||||||||||||||||||
| Gallup | |||||||||||||||||||||||||||||||||||||||||||||||||||||||||||||||||||||||||||||||||||||||||||||||||||
Gallup.com reports results from these indexes in daily, weekly and monthly averages and in Gallup.com stories. Complete trend data are always available to view in the following charts:
Daily: Employment, Economic Confidence and Job Creation, Consumer Spending
Weekly: Employment, Economic Confidence, Job Creation, Consumer Spending
Read more about Gallup's economic measures.
View our economic release schedule.
Survey Methods
Results for this Gallup poll are based on telephone interviews conducted March 1-31, 2016, on the Gallup U.S. Daily survey, with a random sample of 30,469 adults, aged 18 and older, living in all 50 U.S. states and the District of Columbia. For results based on the total sample of national adults, the margin of sampling error is ±1 percentage point at the 95% confidence level. All reported margins of sampling error include computed design effects for weighting.
Each sample of national adults includes a minimum quota of 60% cellphone respondents and 40% landline respondents, with additional minimum quotas by time zone within region. Landline and cellular telephone numbers are selected using random-digit-dial methods.
Learn more about how Gallup Daily tracking works.