Story Highlights
- Index gains three points, matching its previous high of +32
- Increase is first for the index since May 2015
- Hiring picture improves for government workers
WASHINGTON, D.C. -- Gallup's monthly U.S. Job Creation Index climbed to +32 in March, matching the highest level of its eight-year history. The increase from February's +29 reading is the first upward movement since May of last year, when the index first reached the +32 level.
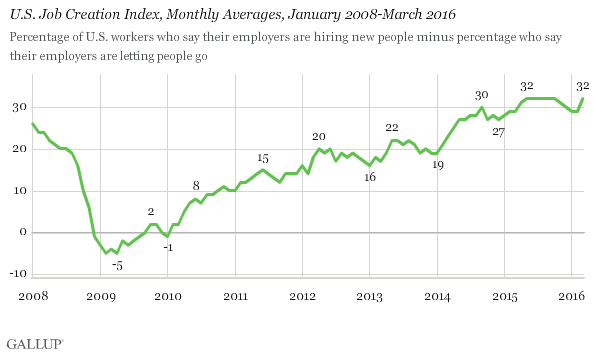
The latest results are based on interviews conducted March 1-31 with 17,997 full- and part-time U.S. workers. As part of Gallup's Daily tracking survey, interviewers ask a random sample of employed workers nationwide each day whether their employers are increasing, reducing or maintaining the size of their workforce. In March, 43% of workers reported an increase and 11% a decrease, resulting in the Job Creation Index score of +32.
Gallup's initial measurement of hiring activity in January 2008 recorded a +26 score, but the index dropped steadily for the next 13 months in the midst of the nation's economic crash. After bottoming out in February 2009 at -5 -- a month when 28% of workers reported workforce reductions, while only 23% reported increases -- the index has taken a slow, bumpy path upward, with major gains in 2010 and 2014.
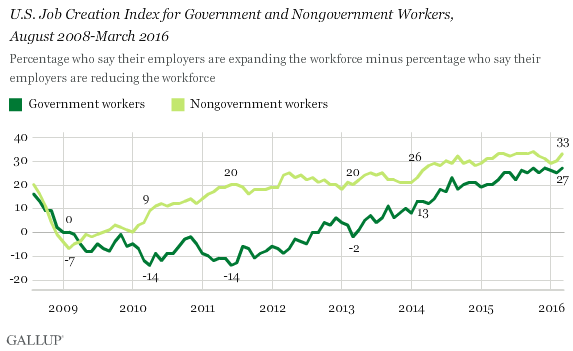
Government Job Creation Increases, Still Behind Nongovernment
The March Job Creation Index for government workers was +27 -- an increase of two points from February's +25, seven points from +20 a year ago and 29 points from -2 in March 2013. The nongovernment workers' index for March increased three points to +33.
Nongovernment workers have been more likely to report greater job growth than government workers in all but five of the 92 months since Gallup included the government/nongovernment breakdown in the index in late 2008. However, the gap between the two -- as large as 34 points in June 2011 -- has closed considerably over the past three years, from 22 points in March 2013 to six points now.
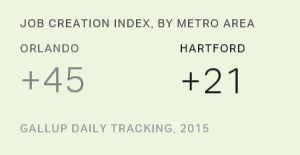
East, Weakest Region in Job Creation, Gains Four Points in March
Job Creation Indexes for all four major regions -- East, Midwest, South and West -- showed gains in March. The East, which has trailed the other three regions for most of the past three years, climbed closer to them with a four-point gain, from +26 in February to +30 in March. The other three regions each gained two points: the South, from +29 to +31; the Midwest, from +30 to +32; and the West, from +32 to +34.
Bottom Line
A three-point or greater increase in the monthly Job Creation Index may not seem impressive at first glance, but it has been achieved only six times in the eight-plus years since the index was created -- and had not occurred since May 2013.
Further, March's +32 rating provides additional proof that, despite global economic concerns and months of volatility in the U.S. stock market, American employers by and large are still in a hiring mood. It's a finding backed up by the Bureau of Labor Statistics report on April 1 that the U.S. economy added 215,000 jobs in March.
The increase in available jobs across the U.S. helps explain the growth of the U.S. labor force by nearly 400,000 people in March, and the continuing rise in the share of adults who are either working or actively looking for work.
Survey Methods
Results for this Gallup poll are based on telephone interviews conducted March 1-31, 2016, on the Gallup U.S. Daily survey, with a random sample of 17,997 employed adults, aged 18 and older, living in all 50 U.S. states and the District of Columbia. For results based on the total sample of employed adults, the margin of sampling error is ±1 percentage point at the 95% confidence level. All reported margins of sampling error include computed design effects for weighting.
Each sample of national adults includes a minimum quota of 60% cellphone respondents and 40% landline respondents, with additional minimum quotas by time zone within region. Landline and cellular telephone numbers are selected using random-digit-dial methods.
Learn more about how the Gallup U.S. Daily works.