Story Highlights
- No sign of improvement so far in May
- Nearly six in 10 say economy is getting worse
- 25% rate current conditions positively, versus 30% negatively
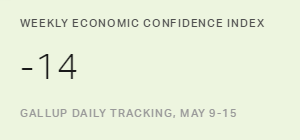
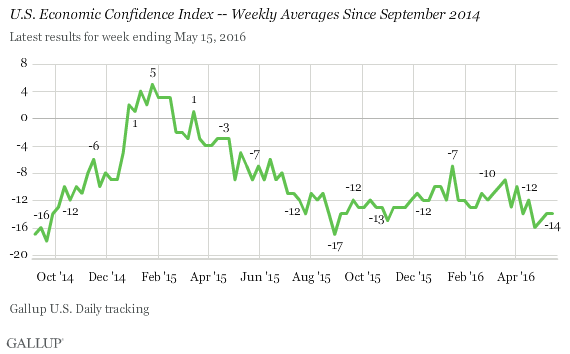
PRINCETON, N.J. -- Americans continue to evaluate the state of the U.S. economy more negatively than positively, with Gallup's Economic Confidence Index holding steady at -14, essentially where it has been since early April. Confidence remains lower than it was for the first half of 2015 and is roughly back to where it was in fall 2014, before sharp declines in gas prices helped make Americans more upbeat about the economy.
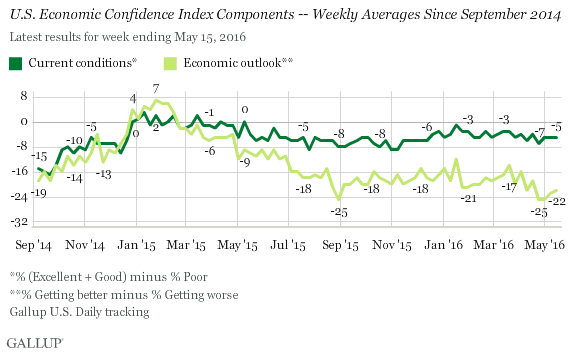
The latest result is a weekly average of Gallup Daily tracking interviewing from May 9-15. Each night, Gallup asks Americans whether current economic conditions in the U.S. are "excellent, good, only fair or poor" and whether they believe the economy is "getting better or getting worse."
Their responses to these two items make up the Gallup U.S. Economic Confidence Index. The index has a theoretical minimum of -100 if all Americans rate current conditions as poor and say they are getting worse, and a theoretical maximum of +100 if all Americans say current conditions are excellent or good and getting better. Last week's score of -14 means Americans were a bit more negative than positive about the economy.
Since the recession, there has only been a short time -- in early 2015, during the extended decline in U.S. gas prices -- when Americans consistently rated the economy positively. Although that positive mood has faded, U.S. consumers remain much less negative today than they were at the height of the recession. Gallup's index fell to as low as -65 in early October 2008, shortly after President George W. Bush signed the Troubled Asset Relief Program (TARP) legislation into law to address the financial crisis.
For the week ending May 15, 25% of Americans rated the economy as "excellent" or "good," while 30% said it was "poor." That resulted in a current conditions score of -5. Meanwhile, 36% said the economy was getting better, and 58% said it was getting worse, producing an economic outlook score of -22.
In late 2014 and early 2015, the current conditions and economic outlook scores were fairly similar. Since last May, however, there has been a notable gap, with Americans offering a more positive evaluation of current conditions than of the economy's direction. In recent weeks, the gap has grown slightly as the outlook score has decreased.
Implications
Americans' slightly negative evaluation of the economy comes at a time when key economic indicators reflect a mixture of strengths and weaknesses in the U.S. economy. The economy has grown fairly consistently since emerging from the recession, but at a low rate. First quarter growth this year was especially disappointing given the milder winter weather, but last week, the government reported a surge in April in retail spending -- the backbone of the U.S. economy. The employment situation remains positive, although the Bureau of Labor Statistics report released in early May suggests the job market could be softening.
Americans' attention to economic matters might be heightened given the issue's importance in the 2016 presidential campaign. Candidates in both parties acknowledge weaknesses in the economy and have put forth their ideas to address those problems in hopes of getting elected. This attention to what is wrong with the economy could make Americans less positive about its future.
These data are available in Gallup Analytics.
Survey Methods
Results for this Gallup poll are based on telephone interviews conducted May 9-15, 2016, on the Gallup U.S. Daily survey, with a random sample of 3,549 adults, aged 18 and older, living in all 50 U.S. states and the District of Columbia. For results based on the total sample of national adults, the margin of sampling error is ±1 percentage point at the 95% confidence level. All reported margins of sampling error include computed design effects for weighting.
Each sample of national adults includes a minimum quota of 60% cellphone respondents and 40% landline respondents, with additional minimum quotas by time zone within region. Landline and cellular telephone numbers are selected using random-digit-dial methods.
Learn more about how Gallup Daily tracking works.