Story Highlights
- More than eight in 10 Sanders supporters say election process not working
- Fewer Clinton backers (60%) feel the same way
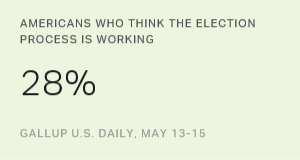
- Overall, almost three in 10 in U.S. say election working as it should
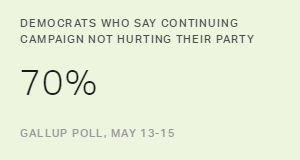
PRINCETON, N.J. -- Neither political party's supporters think the election process is working as it should, but Democrats who back Bernie Sanders (17%) are less than half as likely as those who prefer Hillary Clinton for the nomination (39%) to feel positively about the process. On the flip side, more than eight in 10 of the Vermont senator's supporters (81%) say the process is not working, exceeding the 60% of Democratic Clinton supporters who feel the same way.
| Yes, as it should | No, not as it should | No opinion | |||||||||||||||||||||||||||||||||||||||||||||||||||||||||||||||||||||||||||||||||||||||||||||||||
|---|---|---|---|---|---|---|---|---|---|---|---|---|---|---|---|---|---|---|---|---|---|---|---|---|---|---|---|---|---|---|---|---|---|---|---|---|---|---|---|---|---|---|---|---|---|---|---|---|---|---|---|---|---|---|---|---|---|---|---|---|---|---|---|---|---|---|---|---|---|---|---|---|---|---|---|---|---|---|---|---|---|---|---|---|---|---|---|---|---|---|---|---|---|---|---|---|---|---|---|
| % | % | % | |||||||||||||||||||||||||||||||||||||||||||||||||||||||||||||||||||||||||||||||||||||||||||||||||
| Democrats/Democratic leaners | |||||||||||||||||||||||||||||||||||||||||||||||||||||||||||||||||||||||||||||||||||||||||||||||||||
| Prefer Hillary Clinton as nominee | 39 | 60 | 1 | ||||||||||||||||||||||||||||||||||||||||||||||||||||||||||||||||||||||||||||||||||||||||||||||||
| Prefer Bernie Sanders as nominee | 17 | 81 | 1 | ||||||||||||||||||||||||||||||||||||||||||||||||||||||||||||||||||||||||||||||||||||||||||||||||
| Republicans/Republican leaners | |||||||||||||||||||||||||||||||||||||||||||||||||||||||||||||||||||||||||||||||||||||||||||||||||||
| Pleased with selection of Trump | 35 | 64 | 1 | ||||||||||||||||||||||||||||||||||||||||||||||||||||||||||||||||||||||||||||||||||||||||||||||||
| Wish someone else were nominee | 23 | 75 | 2 | ||||||||||||||||||||||||||||||||||||||||||||||||||||||||||||||||||||||||||||||||||||||||||||||||
| Gallup, May 13-15, 2016 | |||||||||||||||||||||||||||||||||||||||||||||||||||||||||||||||||||||||||||||||||||||||||||||||||||
The views of Sanders and Clinton supporters about the process have not changed much over the past month.
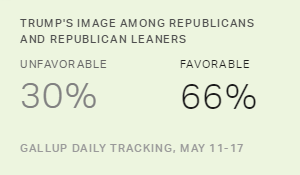
Although the Republican nomination is essentially settled now that Donald Trump's main competitors have dropped out or suspended their campaigns, 35% of Republicans and Republican-leaning independents who are pleased with the selection of Trump -- or about half of Republicans -- say the election process is working. In April, when Ted Cruz was still waging a spirited campaign against Trump, just 25% of Republicans who backed Trump for the nomination thought the process was working well, compared with 32% of Cruz supporters.
Overall, 28% of all U.S. adults this month say the election process is working, similar to the 27% in April but down from 33% in February and 37% in January. Over these five months, Democrats' satisfaction with the process has been fairly steady near 30%, while Republicans' fell from 46% at the start of the year to 30% by March and has since remained near that level.
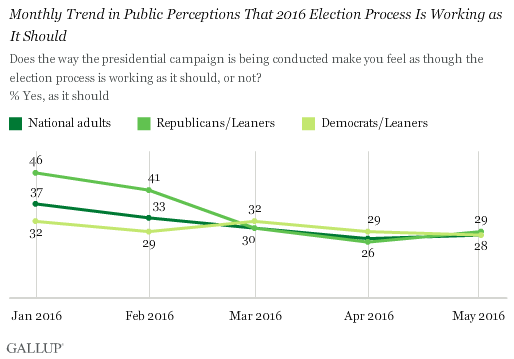
Current public skepticism about the election process contrasts with early 2000 and 2008, when about half or even two-thirds of Americans -- including majorities of Republicans and Democrats -- thought the process was working as it should.
| National adults | Republicans/Leaners | Democrats/Leaners | |||||||||||||||||||||||||||||||||||||||||||||||||||||||||||||||||||||||||||||||||||||||||||||||||
|---|---|---|---|---|---|---|---|---|---|---|---|---|---|---|---|---|---|---|---|---|---|---|---|---|---|---|---|---|---|---|---|---|---|---|---|---|---|---|---|---|---|---|---|---|---|---|---|---|---|---|---|---|---|---|---|---|---|---|---|---|---|---|---|---|---|---|---|---|---|---|---|---|---|---|---|---|---|---|---|---|---|---|---|---|---|---|---|---|---|---|---|---|---|---|---|---|---|---|---|
| % | % | % | |||||||||||||||||||||||||||||||||||||||||||||||||||||||||||||||||||||||||||||||||||||||||||||||||
| May 13-15, 2016 | 28 | 29 | 28 | ||||||||||||||||||||||||||||||||||||||||||||||||||||||||||||||||||||||||||||||||||||||||||||||||
| Apr 15-17, 2016 | 27 | 26 | 29 | ||||||||||||||||||||||||||||||||||||||||||||||||||||||||||||||||||||||||||||||||||||||||||||||||
| Mar 16-17, 2016 | 30 | 30 | 32 | ||||||||||||||||||||||||||||||||||||||||||||||||||||||||||||||||||||||||||||||||||||||||||||||||
| Feb 15-16, 2016 | 33 | 41 | 29 | ||||||||||||||||||||||||||||||||||||||||||||||||||||||||||||||||||||||||||||||||||||||||||||||||
| Jan 15-16, 2016 | 37 | 46 | 32 | ||||||||||||||||||||||||||||||||||||||||||||||||||||||||||||||||||||||||||||||||||||||||||||||||
| Dec 15-18, 2011 | 39 | 49 | 31 | ||||||||||||||||||||||||||||||||||||||||||||||||||||||||||||||||||||||||||||||||||||||||||||||||
| Jan 10-13, 2008 | 67 | 66 | 71 | ||||||||||||||||||||||||||||||||||||||||||||||||||||||||||||||||||||||||||||||||||||||||||||||||
| Dec 14-16, 2007 | 47 | 46 | 52 | ||||||||||||||||||||||||||||||||||||||||||||||||||||||||||||||||||||||||||||||||||||||||||||||||
| Mar 10-12, 2000 | 53 | 54 | 54 | ||||||||||||||||||||||||||||||||||||||||||||||||||||||||||||||||||||||||||||||||||||||||||||||||
| Gallup | |||||||||||||||||||||||||||||||||||||||||||||||||||||||||||||||||||||||||||||||||||||||||||||||||||
Although Gallup's trend on this question is limited, only in December 2011 were attitudes nearly as dour as they are today. At that point, only 39% of Americans thought the election process was working well. And the results by party were remarkably similar to what Gallup found in January of this year: roughly half of Republicans (49%) versus nearly a third of Democrats (31%) thought the process was working well.
One similarity between the 2011-2012 and 2015-2016 election cycles is concern about overexposure of the Republican candidates because of the number of debates, the number of candidates or both. In January 2015, Reince Priebus, chairman of the Republican National Committee, said he thought the number of Republican debates and forums during the 2011-2012 cycle -- 27 total -- damaged the party's image by giving too much airtime to Republicans' attacks on each other. As a result, Priebus limited the number of debates this cycle; since last October, there have been 12. But the unprecedented number of candidates running this time, with Trump launching sharp attacks on his opponents, has produced as much if not more of a spectacle.
Bottom Line
Sanders' supporters have their reasons to be frustrated with an election process that seems destined to deliver the Democratic nomination to his opponent. Even if Sanders manages to win a similar number of delegates to Clinton's in the state primaries and caucuses, her commanding lead among Democratic "superdelegates" has tilted the nomination process strongly in Clinton's favor. That could explain the higher percentage of Sanders than Clinton supporters who today say the election process is not working as it should. However, Democrats have been critical of the process as far back as January, most likely reflecting their views of the Republicans' highly fractured and divisive race as much as the Democratic one.
And, echoing the sentiment from late 2011, the year began with Republicans feeling better than Democrats about the election process. But as GOP candidates started dropping out, and personal attacks among the remaining ones became the campaign's prominent feature, Republicans' satisfaction fell in March to match Democrats' and has since remained low.
Both parties have an opportunity to put a more positive spin on the process at their nominating conventions this summer, as well as during the presidential debates this fall. However, if those events fail to convince Americans that democracy is on course, voters' low satisfaction with the process could contribute to lower turnout in the election this fall.
Survey Methods
Results for this Gallup poll are based on telephone interviews conducted May 13-15, 2016, on the Gallup U.S. Daily survey, with a random sample of 1,537 adults, aged 18 and older, living in all 50 U.S. states and the District of Columbia. For results based on the total sample of national adults, the margin of sampling error is ±3 percentage points at the 95% confidence level.
For results based on the sample of 699 Democrats and Democratic-leaning independents, the margin of error is ±5 percentage points at the 95% confidence level. For results based on the sample of 677 Republicans and Republican-leaning independents, the margin of error is ±5 percentage points at the 95% confidence level. All reported margins of sampling error include computed design effects for weighting.
Each sample of national adults includes a minimum quota of 60% cellphone respondents and 40% landline respondents, with additional minimum quotas by time zone within region. Landline and cellular telephone numbers are selected using random-digit-dial methods.
Learn more about how the Gallup U.S. Daily works.