Story Highlights
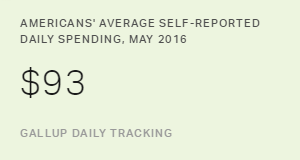
- Average of $93 for May similar to $95 for April
- Spending remains well above 2009-2012 levels
- May spending is typically stronger than June spending
PRINCETON, N.J. -- Americans' daily self-reports of spending averaged $93 in May, similar to the average $95 in April as well as in May 2015 ($91). The latest number indicates consumer spending remained elevated after an uptick in April, but did not increase further.
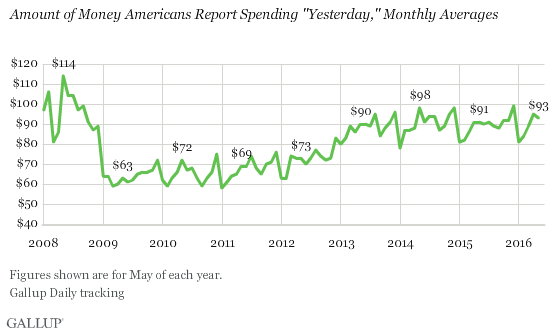
The May results reflect two larger trends in Gallup tracking of consumer spending habits: generally higher spending in the spring months than in the winter months, and higher spending in recent years than from 2009 through early 2012. During that earlier period, as the U.S. suffered through recession and high unemployment, average daily reports of spending consistently held below $80. In late 2012, consumer activity began to pick up and continued to do so into 2013. Since May 2013, average spending has been $90.
Gallup asks Americans each night as part of Gallup Daily tracking to report how much they spent or charged "yesterday," excluding normal household bills and major purchases such as a home or vehicle. The estimate gives a sense of Americans' discretionary spending.
The surge in Gallup's daily spending reports in April was confirmed by a subsequent Department of Commerce report finding an unusually large spike in retail spending in April. That increase came after sluggish spending in the first quarter, resulting in weak economic growth. Gallup's latest spending estimate suggests there was not a major falloff in spending in May.
Spending changes between April and May have not followed a consistent pattern in Gallup's trend. In most years, the two figures are similar, but there have been two instances, in 2008 and 2014, of increases in May. Those surges came after relatively weak April estimates, suggesting the usual spring increase may have been delayed in those years. The May 2008 spike was also likely primed by government rebate checks sent to all Americans, beginning in late April, as part of the economic stimulus plan.
| April | May | June | |||||||||||||||||||||||||||||||||||||||||||||||||||||||||||||||||||||||||||||||||||||||||||||||||
|---|---|---|---|---|---|---|---|---|---|---|---|---|---|---|---|---|---|---|---|---|---|---|---|---|---|---|---|---|---|---|---|---|---|---|---|---|---|---|---|---|---|---|---|---|---|---|---|---|---|---|---|---|---|---|---|---|---|---|---|---|---|---|---|---|---|---|---|---|---|---|---|---|---|---|---|---|---|---|---|---|---|---|---|---|---|---|---|---|---|---|---|---|---|---|---|---|---|---|---|
| $ | $ | $ | |||||||||||||||||||||||||||||||||||||||||||||||||||||||||||||||||||||||||||||||||||||||||||||||||
| 2016 | 95 | 93 | n/a | ||||||||||||||||||||||||||||||||||||||||||||||||||||||||||||||||||||||||||||||||||||||||||||||||
| 2015 | 91 | 91 | 90 | ||||||||||||||||||||||||||||||||||||||||||||||||||||||||||||||||||||||||||||||||||||||||||||||||
| 2014 | 88 | 98 | 91 | ||||||||||||||||||||||||||||||||||||||||||||||||||||||||||||||||||||||||||||||||||||||||||||||||
| 2013 | 86 | 90 | 90 | ||||||||||||||||||||||||||||||||||||||||||||||||||||||||||||||||||||||||||||||||||||||||||||||||
| 2012 | 73 | 73 | 70 | ||||||||||||||||||||||||||||||||||||||||||||||||||||||||||||||||||||||||||||||||||||||||||||||||
| 2011 | 65 | 69 | 69 | ||||||||||||||||||||||||||||||||||||||||||||||||||||||||||||||||||||||||||||||||||||||||||||||||
| 2010 | 66 | 72 | 67 | ||||||||||||||||||||||||||||||||||||||||||||||||||||||||||||||||||||||||||||||||||||||||||||||||
| 2009 | 60 | 63 | 61 | ||||||||||||||||||||||||||||||||||||||||||||||||||||||||||||||||||||||||||||||||||||||||||||||||
| 2008 | 86 | 114 | 104 | ||||||||||||||||||||||||||||||||||||||||||||||||||||||||||||||||||||||||||||||||||||||||||||||||
| Gallup Daily tracking | |||||||||||||||||||||||||||||||||||||||||||||||||||||||||||||||||||||||||||||||||||||||||||||||||||
Notably, Gallup has yet to see an increase in average spending from May to June in any of the prior eight years that it has tracked consumer spending. Thus, if history is a guide, one would expect June spending this year to be at or below May's level.
Implications
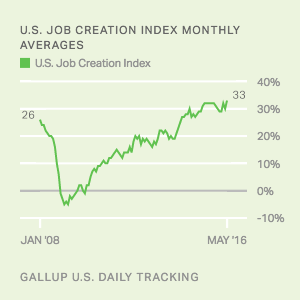
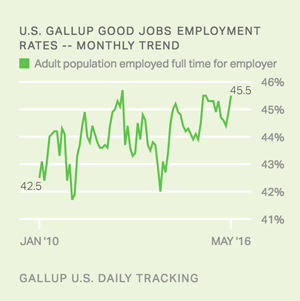
U.S. consumers report spending about as freely in May as they did in April. This bodes well for U.S. economic growth in the second quarter, after a weak first quarter that had many economic experts questioning just how strong the economic recovery is. The Department of Commerce's report of strong retail spending in April likely eased some of those fears, at least temporarily, but the Bureau of Labor Statistics May employment report released Friday raised new concerns about possible weakness in the job market. Gallup's own employment metrics -- the Job Creation Index and the Gallup Good Jobs Index -- as well as the ADP jobs report were more positive about the May job market.
As such, key economic indicators do not provide a clear picture of whether the economy is strong or weak. Americans themselves continue to evaluate it more negatively than positively. The Federal Reserve Board -- arguably the most important government economic actor -- will meet later this month and decide whether to increase interest rates again, with that decision hinging on its assessment of the economy.
These data are available in Gallup Analytics.
Survey Methods
Results for this Gallup poll are based on telephone interviews conducted May 1-31, 2016, on the Gallup U.S. Daily survey, with a random sample of 15,803 adults, aged 18 and older, living in all 50 U.S. states and the District of Columbia. For results based on the total sample of national adults, the margin of error for the spending mean is ±$5 at the 95% confidence level. All reported margins of sampling error include computed design effects for weighting.
Each sample of national adults includes a minimum quota of 60% cellphone respondents and 40% landline respondents, with additional minimum quotas by time zone within region. Landline and cellular telephone numbers are selected using random-digit-dial methods.
Learn more about how the Gallup U.S. Daily works.