Story Highlights
- Highest Gallup Good Jobs rate in six years of measurement
- Unemployment down to 5.3%, lowest in any June since 2010
- Workforce participation at 67.5%
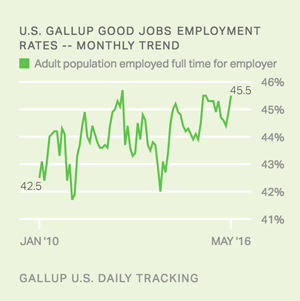
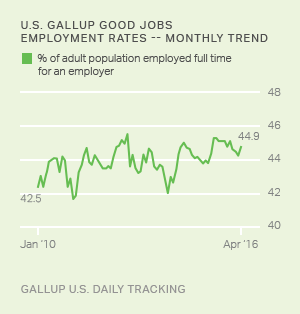
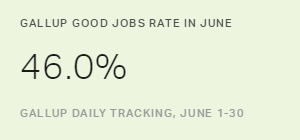
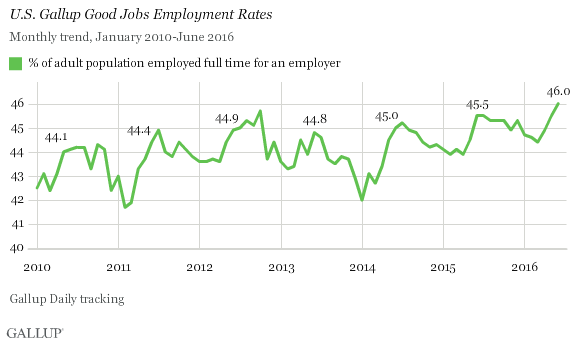
WASHINGTON, D.C. -- The Gallup Good Jobs (GGJ) rate in the U.S. was 46.0% in June. This is up nominally from May (45.5%) and stands as the highest monthly rate Gallup has recorded since measurement began in 2010. The current rate is also half a percentage point higher than in June 2015, suggesting an underlying increase in full-time work beyond seasonal changes in employment.
The GGJ metric tracks the percentage of U.S. adults, aged 18 and older, who work for an employer full time -- at least 30 hours per week. Gallup does not count adults who are self-employed, work fewer than 30 hours per week, are unemployed or are out of the workforce as payroll-employed in the GGJ metric.
The latest results are based on Gallup Daily tracking interviews with 30,395 U.S. adults, conducted June 1-30 by landline telephone and cellphone. GGJ is not seasonally adjusted.
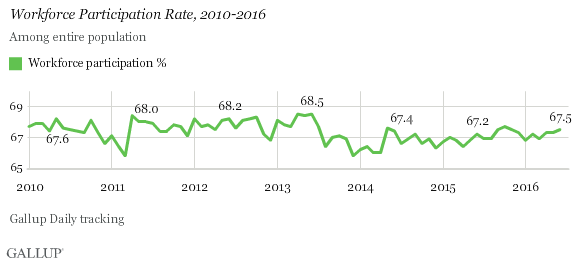
Workforce Participation at 67.5% in June
The percentage of U.S. adults in June who participated in the workforce -- by working full time, part time or not working but actively seeking and being available for work -- was 67.5%. This is up nominally from May's 67.3% and above the 66.9% average workforce participation rate since June 2013. Current workforce participation is slightly lower than the period from May 2010 to June 2013 when it averaged 67.7%.
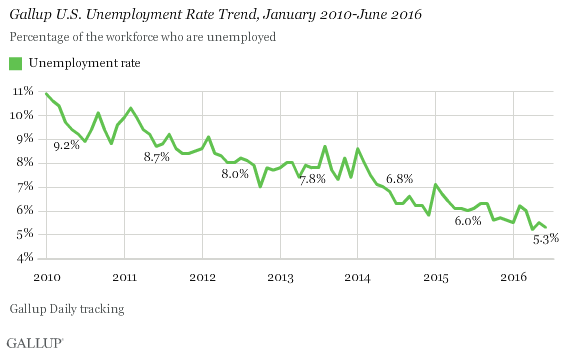
Unemployment at 5.3%
Gallup's unadjusted U.S. unemployment rate was 5.3% in June, down nominally from May's 5.5%. June's unemployment estimate is the second lowest for any month since Gallup began tracking the measure in 2010, after reaching 5.2% in April of this year. Gallup's U.S. unemployment rate represents the percentage of adults in the workforce who did not have any paid work in the past seven days, either for an employer or for themselves, and who were actively looking for and available to work.
Unlike the Gallup Good Jobs rate, which is a percentage of the total population, the unemployment rates that Gallup and the U.S. Bureau of Labor Statistics (BLS) report are percentages of the labor force. While both Gallup and BLS data are based on surveys with large sample sizes, the two have important methodological differences -- outlined at the end of this article. Additionally, the most-discussed unemployment rate released by the BLS each month is seasonally adjusted, while Gallup reports unadjusted numbers. Although Gallup's unemployment numbers strongly correlate with BLS rates, the BLS and Gallup estimates of unemployment do not always track precisely on a monthly basis.
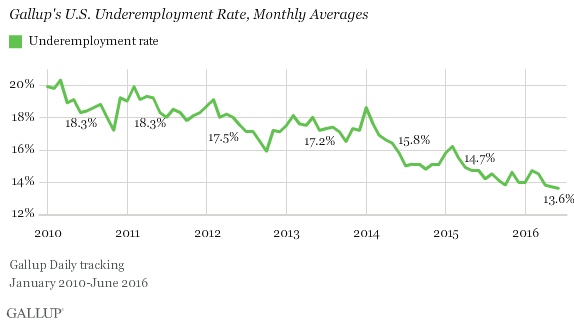
Underemployment Down Slightly at 13.6%
Gallup's measure of underemployment in June was 13.6%, almost the same as May's (13.7%) yet also the lowest Gallup has recorded since 2010. June's rate also marks the fourth straight month of declining underemployment from February's rate of 14.7%. Gallup's U.S. underemployment rate combines the percentage of adults in the workforce who are unemployed (5.3%) with those who are working part time but desire full-time work (8.3%).
Bottom Line
Based on the seasonal patterns observed over the past six years, full-time employment generally peaks in midsummer at the same time that unemployment falls. In that sense, this past month's findings are in line with previously observed seasonal patterns. However, June 2016 stands out as having the highest GGJ rate of any June -- or any month at all -- dating back to 2010, as well as one of the lowest unemployment rates that Gallup has yet recorded. This is indicative of a broader, continuing improvement in the U.S. labor market beneath the seasonal ups and downs.
The data in this article are available in Gallup Analytics.
| Most recent month (June 2016) | Previous month (May 2016) | Month a year ago (June 2015) | |||||||||||||||||||||||||||||||||||||||||||||||||||||||||||||||||||||||||||||||||||||||||||||||||
|---|---|---|---|---|---|---|---|---|---|---|---|---|---|---|---|---|---|---|---|---|---|---|---|---|---|---|---|---|---|---|---|---|---|---|---|---|---|---|---|---|---|---|---|---|---|---|---|---|---|---|---|---|---|---|---|---|---|---|---|---|---|---|---|---|---|---|---|---|---|---|---|---|---|---|---|---|---|---|---|---|---|---|---|---|---|---|---|---|---|---|---|---|---|---|---|---|---|---|---|
| % | % | % | |||||||||||||||||||||||||||||||||||||||||||||||||||||||||||||||||||||||||||||||||||||||||||||||||
| Employed full time for employer (GGJ)* | 46.0 | 45.5 | 45.5 | ||||||||||||||||||||||||||||||||||||||||||||||||||||||||||||||||||||||||||||||||||||||||||||||||
| Employed full time for self* | 5.7 | 5.7 | 5.3 | ||||||||||||||||||||||||||||||||||||||||||||||||||||||||||||||||||||||||||||||||||||||||||||||||
| Workforce participation rate* | 67.5 | 67.3 | 67.2 | ||||||||||||||||||||||||||||||||||||||||||||||||||||||||||||||||||||||||||||||||||||||||||||||||
| Unemployment rate** | 5.3 | 5.5 | 6.0 | ||||||||||||||||||||||||||||||||||||||||||||||||||||||||||||||||||||||||||||||||||||||||||||||||
| Employed part time wanting full time** | 8.3 | 8.2 | 8.7 | ||||||||||||||||||||||||||||||||||||||||||||||||||||||||||||||||||||||||||||||||||||||||||||||||
| Underemployment rate** | 13.6 | 13.7 | 14.7 | ||||||||||||||||||||||||||||||||||||||||||||||||||||||||||||||||||||||||||||||||||||||||||||||||
| **Metrics represent percentages of the U.S. workforce. | |||||||||||||||||||||||||||||||||||||||||||||||||||||||||||||||||||||||||||||||||||||||||||||||||||
| *Metrics represent percentages of the U.S. population aged 18 or older who have a job or are actively seeking work. | |||||||||||||||||||||||||||||||||||||||||||||||||||||||||||||||||||||||||||||||||||||||||||||||||||
Daily: Employment, Economic Confidence and Job Creation, Consumer Spending
Weekly: Employment, Economic Confidence, Job Creation, Consumer Spending
Read more about Gallup's economic measures.
View our economic release schedule.
Survey Methods
Results for this Gallup poll are based on telephone interviews conducted June 1-30, 2016, on the Gallup U.S. Daily survey, with a random sample of 30,395 adults, aged 18 and older, living in all 50 U.S. states and the District of Columbia. For results based on the total sample of national adults, the margin of sampling error is ±1 percentage point at the 95% confidence level. All reported margins of sampling error include computed design effects for weighting.
Each sample of national adults includes a minimum quota of 60% cellphone respondents and 40% landline respondents, with additional minimum quotas by time zone within region. Landline and cellular telephone numbers are selected using random-digit-dial methods.
Learn more about how the Gallup U.S. Daily works.