Story Highlights
- Economic Confidence Index stable at -15
- Economic outlook index component remains near 12-month low
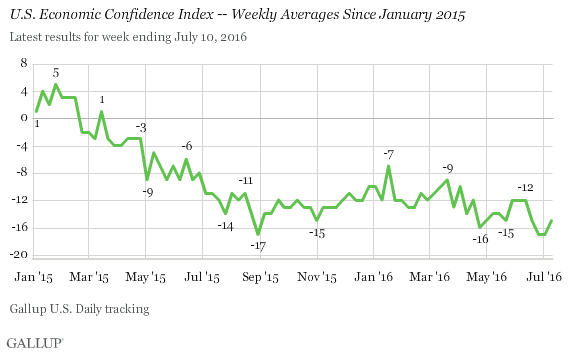
WASHINGTON, D.C. -- The Gallup U.S. Economic Confidence Index held steady for the week ending July 10, with no sign that Friday's strong jobs report left Americans any more optimistic about the economy. The index, a broad measure of Americans' confidence in the U.S. economy, averaged -15 for the week, essentially unchanged from -17 the prior week. The current score is also in line with most weekly readings since April.
On July 8, the Bureau of Labor Statistics announced the U.S. economy added 287,000 jobs in June, well above expectations and a sharp rebound from May's report. Partly in reaction to this and amid receding fears about the harm the Brexit vote might inflict on the U.S. economy, the markets finished last week strongly, with the Dow Jones industrial average climbing 251 points on Friday and the Standard & Poor's 500 index ending the week near a new closing high.
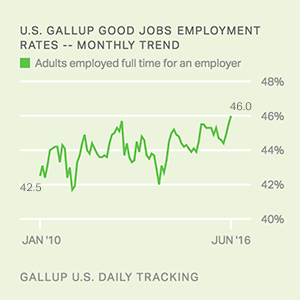
In addition to these positive economic signs, Gallup found that the Gallup Good Jobs rate reached a record high in June. But if all these signals suggest the U.S. economy is gaining ground, Gallup's U.S. Economic Confidence Index shows this has yet to register with many Americans. Comparing responses from the U.S. adults Gallup contacted between last Tuesday and Friday with those contacted on Saturday and Sunday, there is no noticeable uptick in economic confidence among the latter group.
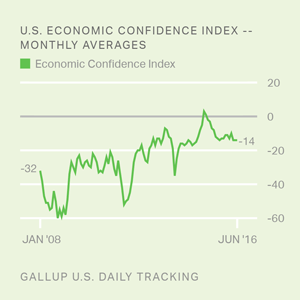
Gallup's U.S. Economic Confidence Index is the average of two components: how Americans rate current economic conditions and whether they feel the economy is improving or getting worse. The index has a theoretical maximum of +100 if all Americans say the economy is doing well and improving, and a theoretical minimum of -100 if all Americans say the economy is doing poorly and getting worse.
Ratings of Current Conditions Slightly More Stable Than Outlook
For the week ending July 10, 25% of Americans rated the economy as "good" or "excellent," while 31% said it was "poor." This left the current conditions score at -6, virtually unchanged from the score of -7 during the week ending July 3. Meanwhile, 36% of U.S. adults last week said the economy was getting better, while 60% said it was getting worse, resulting in an economic outlook score of -24. This was essentially no different from the prior week's -26.
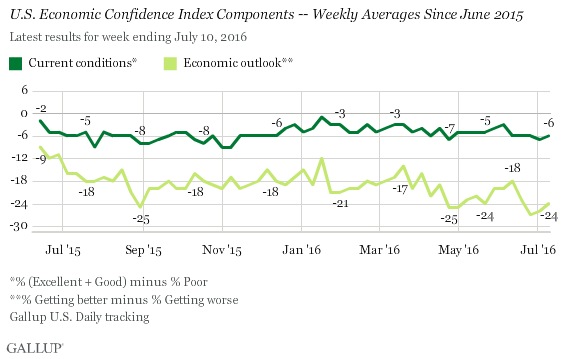
Americans' assessments of the economy's current conditions have fluctuated little over the course of the year, with scores falling in the narrow range of -1 to -7. Conversely, attitudes about the direction of the economy have varied more, with the index hitting a high of -12 in mid-January before falling to -27 in late June. Overall, the Gallup U.S. Economic Confidence Index has seen slight downward movement in 2016 -- something that appears primarily driven by falling expectations for the future direction of the economy.
Bottom Line
The jobs report and stock market gave Americans some genuinely positive news on Friday. However, Americans' views of the economy held steady over the weekend.
As important as the jobs report was, it may have been overshadowed by news coverage of protests over the killing of young black men by police in Louisiana and Minnesota, as well as the killing of five police officers at such a protest in Dallas on Thursday. If Americans have a delayed reaction to the jobs report, it should quickly become evident in this week's Gallup U.S. Economic Confidence Index.
Survey Methods
Results for this Gallup poll are based on telephone interviews conducted July 5-10, 2016, on the Gallup U.S. Daily survey, with a random sample of 3,022 adults, aged 18 and older, living in all 50 U.S. states and the District of Columbia. For results based on the total sample of national adults, the margin of sampling error is ±2 percentage points at the 95% confidence level. All reported margins of sampling error include computed design effects for weighting.
Each sample of national adults includes a minimum quota of 60% cellphone respondents and 40% landline respondents, with additional minimum quotas by time zone within region. Landline and cellular telephone numbers are selected using random-digit-dial methods.
Learn more about how Gallup Daily tracking works.