Story Highlights
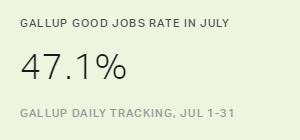
- 47.1% is the highest Gallup Good Jobs rate in six years of measurement
- 5.1% is the lowest unemployment Gallup has measured in same period
- Workforce participation at 67.8%, highest since June 2013
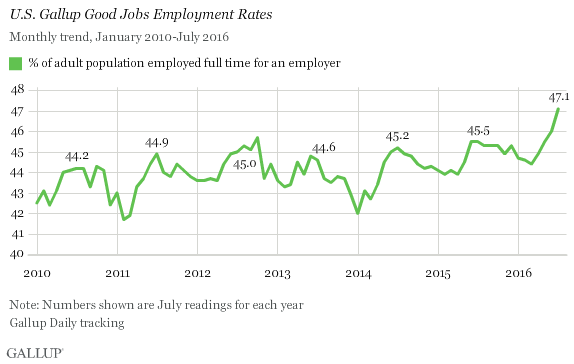
WASHINGTON, D.C. -- The Gallup Good Jobs (GGJ) rate in the U.S. was 47.1% in July, an improvement from June's 46.0%, which had been the highest monthly rate Gallup has recorded since measurement began in 2010. The current rate is also 1.6 percentage points higher than in July 2015, suggesting an underlying increase in full-time work beyond seasonal changes in employment.
The GGJ metric tracks the percentage of U.S. adults, aged 18 and older, who work for an employer full time -- at least 30 hours per week. Gallup does not count adults who are self-employed, work fewer than 30 hours per week, are unemployed or are out of the workforce as payroll-employed in the GGJ metric. The Gallup Good Jobs metric does not take into account factors such as job satisfaction or salary level but merely reflects full-time employment for an employer.
The latest results are based on Gallup Daily tracking interviews with 28,319 U.S. adults, conducted July 1-31 by landline telephone and cellphone. GGJ is not seasonally adjusted.
When Gallup first measured the GGJ rate in January 2010, a time when unemployment remained high, 42.5% of Americans were employed full time by an employer. GGJ fell as low as 41.7% in February 2011 but improved over the next few months. Before this year, the high point was 45.7% in October 2012.
Gallup Good Jobs rates exhibit seasonal patterns -- they typically peak in June or July, with the lowest levels coming at the beginning and end of each year. Thus, this summer's improvement in the measure is partly because of expected seasonal increases, on top of the underlying improvements in the job market more generally.
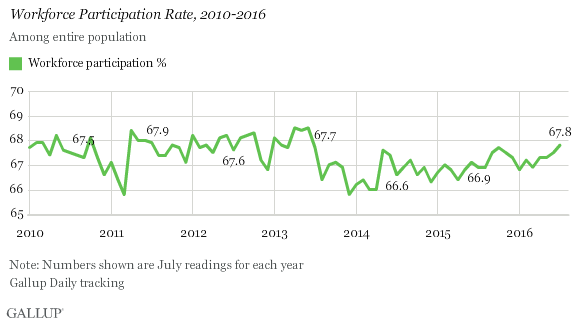
Workforce Participation at 67.8% in July
The percentage of U.S. adults in July who participated in the workforce -- by working full time, working part time or not working but actively seeking and being available for work -- was 67.8%. This is up nominally from 67.5% in June and higher than any month since June 2013. Between January 2010 and June 2013, there were 21 months when Gallup measured 67.8% workforce participation or higher, but none since then until this past month.
Unemployment Hits New Low at 5.1%
Gallup's unadjusted U.S. unemployment rate was 5.1% in July, down nominally from June's 5.3%. July's unemployment estimate is the lowest for any month since Gallup began tracking the measure in 2010, besting the 5.2% measured in April of this year. Gallup's U.S. unemployment rate represents the percentage of adults in the workforce who did not have any paid work in the past seven days, either for an employer or for themselves, and who were actively looking for and available to work.
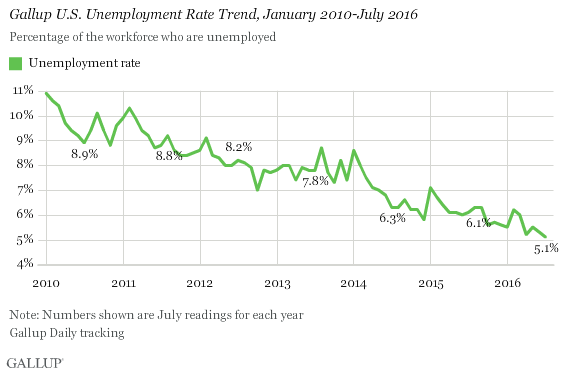
Unlike the Gallup Good Jobs rate, which is a percentage of the total population, the unemployment rates that Gallup and the U.S. Bureau of Labor Statistics (BLS) report are percentages of the labor force. While both Gallup and BLS data are based on surveys with large sample sizes, the two have important methodological differences -- outlined at the end of this article. Additionally, the most-discussed unemployment rate released by the BLS each month is seasonally adjusted, while Gallup reports unadjusted numbers. Although Gallup's unemployment numbers strongly correlate with BLS rates, the BLS and Gallup estimates of unemployment do not always track precisely on a monthly basis.
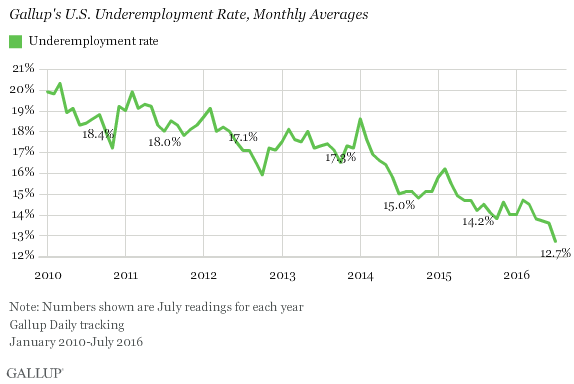
Underemployment Down at 12.7%
Gallup's measure of underemployment in July was 12.7%, down from 13.6% in June and also the lowest Gallup has recorded since 2010. July's rate also marks the fifth straight month of declining underemployment from February's rate of 14.7%. Gallup's U.S. underemployment rate combines the percentage of adults in the workforce who are unemployed (5.1%) with those who are working part time but desire full-time work (7.6%). Underemployment was around 20% when Gallup started measuring it more than six years ago.
Bottom Line
Full-time employment usually peaks in the midsummer months, so in that regard, the record-high GGJ rates reached during the past two months are in line with past seasonal trends. However, the highs reached this summer show growth not just since the beginning of the year, but also on a year-over-year basis. Slowly but surely, the U.S. employment situation continues to strengthen.
The data in this article are available in Gallup Analytics.
| Most recent month (July 2016) | Previous month (June 2016) | Month a year ago (July 2015) | |||||||||||||||||||||||||||||||||||||||||||||||||||||||||||||||||||||||||||||||||||||||||||||||||
|---|---|---|---|---|---|---|---|---|---|---|---|---|---|---|---|---|---|---|---|---|---|---|---|---|---|---|---|---|---|---|---|---|---|---|---|---|---|---|---|---|---|---|---|---|---|---|---|---|---|---|---|---|---|---|---|---|---|---|---|---|---|---|---|---|---|---|---|---|---|---|---|---|---|---|---|---|---|---|---|---|---|---|---|---|---|---|---|---|---|---|---|---|---|---|---|---|---|---|---|
| % | % | % | |||||||||||||||||||||||||||||||||||||||||||||||||||||||||||||||||||||||||||||||||||||||||||||||||
| Employed full time for employer (GGJ)* | 47.1 | 46.0 | 45.5 | ||||||||||||||||||||||||||||||||||||||||||||||||||||||||||||||||||||||||||||||||||||||||||||||||
| Employed full time self* | 5.7 | 5.7 | 5.6 | ||||||||||||||||||||||||||||||||||||||||||||||||||||||||||||||||||||||||||||||||||||||||||||||||
| Workforce participation rate* | 67.8 | 67.5 | 66.9 | ||||||||||||||||||||||||||||||||||||||||||||||||||||||||||||||||||||||||||||||||||||||||||||||||
| Unemployment rate ** | 5.1 | 5.3 | 6.1 | ||||||||||||||||||||||||||||||||||||||||||||||||||||||||||||||||||||||||||||||||||||||||||||||||
| Employed part time wanting full time** | 7.6 | 8.3 | 8.1 | ||||||||||||||||||||||||||||||||||||||||||||||||||||||||||||||||||||||||||||||||||||||||||||||||
| Underemployment rate** | 12.7 | 13.6 | 14.2 | ||||||||||||||||||||||||||||||||||||||||||||||||||||||||||||||||||||||||||||||||||||||||||||||||
| *Metrics represent percentages of the U.S. population aged 18 or older who have a job or are actively seeking work. **Metrics represent percentages of the U.S. workforce. | |||||||||||||||||||||||||||||||||||||||||||||||||||||||||||||||||||||||||||||||||||||||||||||||||||
| Gallup | |||||||||||||||||||||||||||||||||||||||||||||||||||||||||||||||||||||||||||||||||||||||||||||||||||
| GALLUP | U.S. Bureau of Labor Statistics | ||||||||||||||||||||||||||||||||||||||||||||||||||||||||||||||||||||||||||||||||||||||||||||||||||
|---|---|---|---|---|---|---|---|---|---|---|---|---|---|---|---|---|---|---|---|---|---|---|---|---|---|---|---|---|---|---|---|---|---|---|---|---|---|---|---|---|---|---|---|---|---|---|---|---|---|---|---|---|---|---|---|---|---|---|---|---|---|---|---|---|---|---|---|---|---|---|---|---|---|---|---|---|---|---|---|---|---|---|---|---|---|---|---|---|---|---|---|---|---|---|---|---|---|---|---|
| Population | 18 and older | 16 and older | |||||||||||||||||||||||||||||||||||||||||||||||||||||||||||||||||||||||||||||||||||||||||||||||||
| Adjustments | Not seasonally adjusted | Seasonally adjusted | |||||||||||||||||||||||||||||||||||||||||||||||||||||||||||||||||||||||||||||||||||||||||||||||||
| Sample size | 30,000 individuals per month | 60,000 households per month | |||||||||||||||||||||||||||||||||||||||||||||||||||||||||||||||||||||||||||||||||||||||||||||||||
| Mode of interview | RDD telephone, including cellphones | Rotating panel with face-to-face and telephone interviewing | |||||||||||||||||||||||||||||||||||||||||||||||||||||||||||||||||||||||||||||||||||||||||||||||||
| Data collection period | Continuous | One-week reference period during mid-month | |||||||||||||||||||||||||||||||||||||||||||||||||||||||||||||||||||||||||||||||||||||||||||||||||
| Reporting frequency | Daily, weekly and monthly, based on 30-day rolling averages | Monthly, based on one-week reference period | |||||||||||||||||||||||||||||||||||||||||||||||||||||||||||||||||||||||||||||||||||||||||||||||||
| Gallup | |||||||||||||||||||||||||||||||||||||||||||||||||||||||||||||||||||||||||||||||||||||||||||||||||||
Gallup.com reports results from these indexes in daily, weekly and monthly averages and in Gallup.com stories. Complete trend data are always available to view in the following charts:
Daily: Employment, Economic Confidence and Job Creation, Consumer Spending
Weekly: Employment, Economic Confidence, Job Creation, Consumer Spending
Read more about Gallup's economic measures.
View our economic release schedule.
Survey Methods
Results for this Gallup poll are based on telephone interviews conducted July 1-31, 2016, on the Gallup U.S. Daily survey, with a random sample of 28,319 adults, aged 18 and older, living in all 50 U.S. states and the District of Columbia. For results based on the total sample of national adults, the margin of sampling error is ±1 percentage point at the 95% confidence level. All reported margins of sampling error include computed design effects for weighting.
Each sample of national adults includes a minimum quota of 60% cellphone respondents and 40% landline respondents, with additional minimum quotas by time zone within region. Landline and cellular telephone numbers are selected using random-digit-dial methods.
Learn more about how the Gallup U.S. Daily works.