Story Highlights
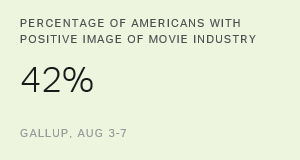
- 42% of Americans have positive views of the movie industry
- Those aged 18 to 34 have consistently given the industry higher ratings
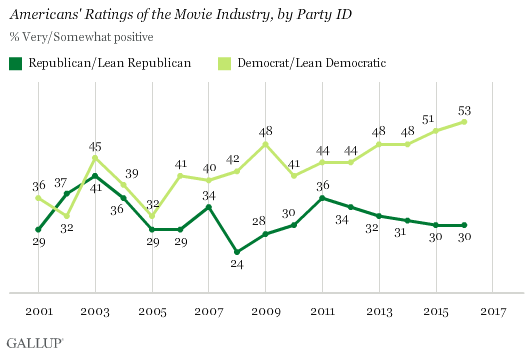
- In recent years, Dems have had increasingly positive views compared with GOP
WASHINGTON, D.C. -- The movie industry's image in the U.S. ties for the most positive in Gallup's 16-year trend, with 42% of Americans saying they have positive views of it. The current rating matches previous highs found in 2003 and 2014.
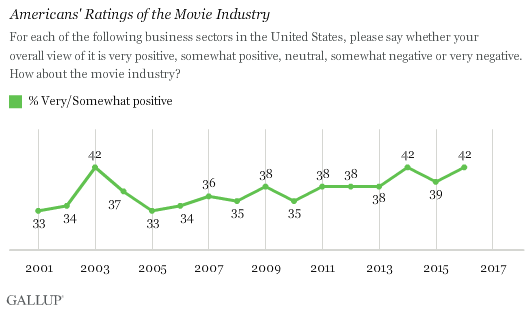
These results are from a Gallup poll conducted Aug. 3-7 asking Americans about their views of 25 U.S. industries, including the airline, healthcare, pharmaceutical, and oil and gas industries. The movie industry's image falls toward the middle of the pack, but it has risen steadily overall since Gallup began asking this question in 2001. In that year and in 2005, a low of 33% rated the movie industry positively.
Americans have more options than ever before when it comes to watching movies -- at the theater, at home on TV, or streamed via computer or smartphone. Although movie ticket prices continue to climb, it has not dampened Americans' enthusiasm for the industry itself. Three of the movie industry's four best annual ratings have occurred in the past three years: 2014, 2015 and 2016. The fourth was in 2003, when "Finding Nemo" hit theaters and smashed previous box office records for animated films.
Democrats' Opinions of Movie Industry Steadily Rise
The gap between Democrats' and Republicans' positive views of the movie industry has widened since Gallup began asking this question in 2001. The two partisan groups had similar views until 2006, when Democrats began to extend more positive ratings. In 2016, 53% of Democrats and independents who lean Democratic view the movie industry positively, up from 36% in 2001. Meanwhile, the industry's positive image among Republicans and independents who lean Republican (30%) is essentially unchanged from 29% in 2001.
Younger Americans Most Positive About Movie Industry
Americans aged 18 to 34 typically rate the movie industry more positively than older age groups. This year, 56% hold positive views of it, on par with an average of 53% among this age group viewing it positively since 2010.
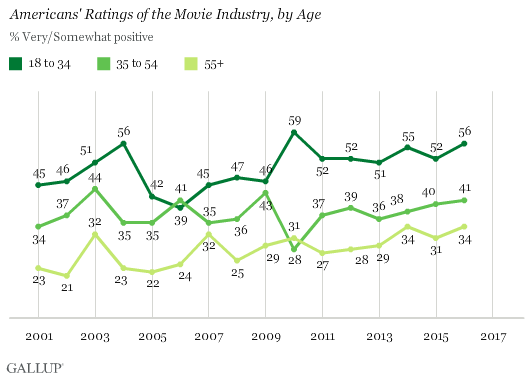
Older adults typically are the least positive about the movie industry -- but the percentage of those aged 55 and older who view the industry positively has increased from 23% in 2001 to 34% today. Sentiments among those aged 35 to 54 have also improved from 34% to 41%. The higher levels seen among younger Americans since 2010 could potentially be attributed to the introduction of streaming services; Netflix pioneered this delivery method in 2007.
Bottom Line
Many factors could be contributing to the general increase in Americans' positive views of the movie industry. In an uncertain age marked by global terrorism and a seemingly divided domestic population, Americans may find solace in going to the movies. This also occurred during the Great Depression of the 1930s, often referred to as the "Golden Age of Hollywood." In a decade that has seen strained race relations and economic collapse, it is possible that Americans are turning to the movies -- whether in a theater or, as is increasingly the case, at home -- to escape reality. Movies have remained relatively inexpensive entertainment compared with going to major sporting events or music concerts.
It is also possible that Americans believe the movie industry is simply performing well. There are more ways to watch films than ever before, and movie production has expanded beyond the traditional Hollywood studio. Thus, Americans may have more options to see the movies they want to see, when they want to see them. Technology has allowed the industry more opportunities to showcase special effects and production values such as IMAX and 3D. And even as ticket prices continue to rise in theaters, streaming options and cable TV offer affordable ways to watch movies at home.
Historical data are available in Gallup Analytics.
Survey Methods
Results for this Gallup poll are based on telephone interviews conducted Aug. 3-7, 2016, with a random sample of 1,032 adults, aged 18 and older, living in all 50 U.S. states and the District of Columbia. For results based on the total sample of national adults, the margin of sampling error is ±4 percentage points at the 95% confidence level. All reported margins of sampling error include computed design effects for weighting.
Each sample of national adults includes a minimum quota of 60% cellphone respondents and 40% landline respondents, with additional minimum quotas by time zone within region. Landline and cellular telephone numbers are selected using random-digit-dial methods.
View complete question responses and trends.
Learn more about how the Gallup Poll Social Series works.