Story Highlights
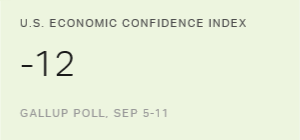
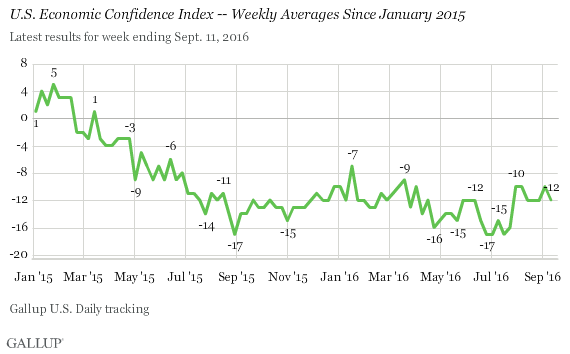
- Index is -12 for the week ending Sept. 11
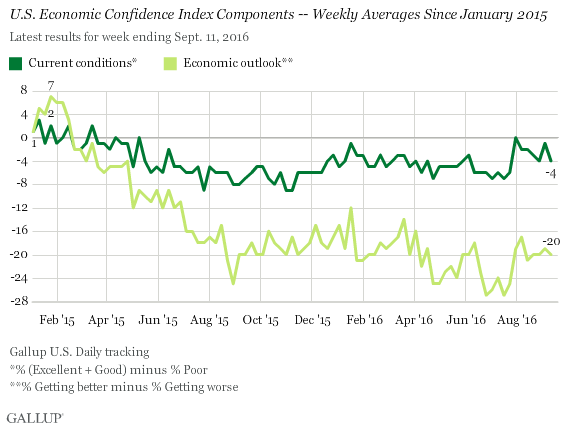
- Current conditions index stands at -4
- Economic outlook index is at -20
WASHINGTON, D.C. -- Americans' confidence in the U.S. economy remained steady for another week, with Gallup's U.S. Economic Confidence Index at -12 for the week ending Sept. 11. The index is essentially unchanged from -10 one week earlier and has been near this level since it gained six points about the same time as the Democratic National Convention in late July.
Gallup's U.S. Economic Confidence Index is the average of two components: how Americans rate current economic conditions and whether they feel the economy is improving or getting worse. The index has a theoretical maximum of +100 if all Americans say the economy is doing well and improving, and a theoretical minimum of -100 if all Americans say the economy is doing poorly and getting worse.
The current conditions score averaged -4 last week, reflecting 26% of Americans saying current economic conditions are "excellent" or "good" and 30% saying they are "poor." The previous reading of the current conditions score was -1.
The economic outlook index stood at -20 for the week, with 37% of Americans saying the economy was "getting better" and 57% saying it was "getting worse." This component was basically unmoved from its -19 reading one week earlier.
Steady Numbers Reflect Relative Stability
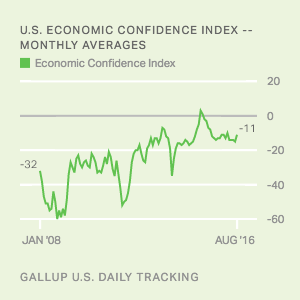
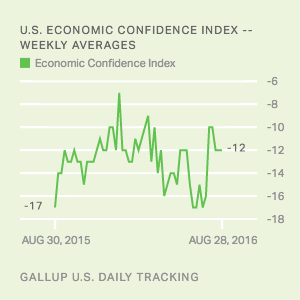
The steadiness of Americans' economic confidence fits into a larger pattern of relative stability that began around this time last year. Gas prices generally rose over the first part of 2015, causing Americans' confidence in the U.S. economy to tumble and knocking the index back into negative territory after hitting its late January 2015 post-recession high of +5. The index hit a yearly low at -17 in late August 2015 as turmoil in the Chinese stock market sent shockwaves through U.S. financial markets and sparked fears of a new global recession.
But the economy instead continued its slow post-recession expansion, and economic confidence began to rebound modestly in the final months of 2015. The index climbed as high as -7 in mid-January 2016 before falling slightly. Though the index has at times fallen as low as -17 and reached as high as -9 since then, it has generally remained slightly below -10 throughout 2016. Its average score for the year is equal to its current reading, at -12.
Even if the index sits at a lower level compared with its early 2015 peak, it is well above the index's all-time low of -65 recorded in October 2008, when the economy struggled after the collapse of several major financial institutions. The current score is slightly better than the index's average score (-20) over the current recovery period that began in July 2009.
Survey Methods
Results for this Gallup poll are based on telephone interviews conducted Sept. 5-11, 2016, on the Gallup U.S. Daily survey, with a random sample of 3,040 adults, aged 18 and older, living in all 50 U.S. states and the District of Columbia. For results based on the total sample of national adults, the margin of sampling error is ±2 percentage points at the 95% confidence level. All reported margins of sampling error include computed design effects for weighting.
Each sample of national adults includes a minimum quota of 60% cellphone respondents and 40% landline respondents, with additional minimum quotas by time zone within region. Landline and cellular telephone numbers are selected using random-digit-dial methods.
Learn more about how the Gallup U.S. Daily works.