Story Highlights
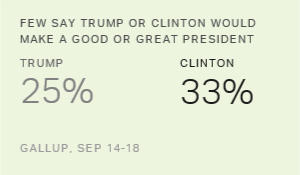
- One in three say Clinton would be a good or great president
- One in four say a Trump presidency would be good or great
- Dems more optimistic about Clinton than GOP is about Trump
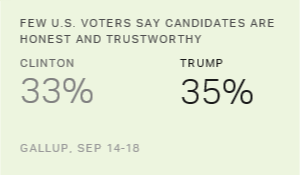
WASHINGTON, D.C. -- The campaigning over the past four months has done little to improve Americans' confidence in the potential presidencies of either major-party candidate. Americans are about as likely to say Hillary Clinton (33%) and Donald Trump (25%) would be a "great" or "good" president as they were in May. More Americans still think each candidate would make a "poor" or "terrible" president than a "good" or "great" one.
| Great/Good | Average | Poor/Terrible | No opinion/Don't know | |||||||||||||||||||||||||||||||||||||||||||||||||||||||||||||||||||||||||||||||||||||||||||||||||
|---|---|---|---|---|---|---|---|---|---|---|---|---|---|---|---|---|---|---|---|---|---|---|---|---|---|---|---|---|---|---|---|---|---|---|---|---|---|---|---|---|---|---|---|---|---|---|---|---|---|---|---|---|---|---|---|---|---|---|---|---|---|---|---|---|---|---|---|---|---|---|---|---|---|---|---|---|---|---|---|---|---|---|---|---|---|---|---|---|---|---|---|---|---|---|---|---|---|---|---|---|
| % | % | % | % | |||||||||||||||||||||||||||||||||||||||||||||||||||||||||||||||||||||||||||||||||||||||||||||||||
| HILLARY CLINTON | ||||||||||||||||||||||||||||||||||||||||||||||||||||||||||||||||||||||||||||||||||||||||||||||||||||
| Sept. 14-18, 2016 | 33 | 20 | 39 | 8 | ||||||||||||||||||||||||||||||||||||||||||||||||||||||||||||||||||||||||||||||||||||||||||||||||
| May 18-22, 2016 | 32 | 19 | 47 | 3 | ||||||||||||||||||||||||||||||||||||||||||||||||||||||||||||||||||||||||||||||||||||||||||||||||
| DONALD TRUMP | ||||||||||||||||||||||||||||||||||||||||||||||||||||||||||||||||||||||||||||||||||||||||||||||||||||
| Sept. 14-18, 2016 | 25 | 15 | 51 | 9 | ||||||||||||||||||||||||||||||||||||||||||||||||||||||||||||||||||||||||||||||||||||||||||||||||
| May 18-22, 2016 | 29 | 14 | 52 | 4 | ||||||||||||||||||||||||||||||||||||||||||||||||||||||||||||||||||||||||||||||||||||||||||||||||
| Gallup | ||||||||||||||||||||||||||||||||||||||||||||||||||||||||||||||||||||||||||||||||||||||||||||||||||||
While more than half of Americans remain pessimistic about the performance of a Trump presidency, fewer are pessimistic about a Clinton presidency now (39%) than in May (47%). This is due to Democrats who initially showed resistance to her nomination (either by supporting Bernie Sanders or saying they wish someone else were the nominee) giving her slightly less negative ratings now than in May. Republicans also rate Clinton a bit less negatively. Among both of these groups, the percentage who rated Clinton's potential presidency as "poor" or "terrible" decreased by five percentage points or more since May. So, while they are not more likely to describe her presidency as "good" or "great," her negative ratings have fallen slightly.
These latest data, collected Sept. 14-18, mirror the lack of movement in each candidate's favorable ratings. Despite the events of the past four months, which included both Clinton and Trump accepting their respective parties' nominations, Americans are no more optimistic about the two potential presidencies than they were a few months ago.
Democrats, Nonwhites Most Optimistic About a Clinton Presidency
Across major subgroups, Democrats (69%) are most likely to say Clinton would be a "great" or "good" president, followed by nonwhites (50%). Clinton doesn't come close to the 50% mark with any other group -- the closest being adults over the age of 55, at 38%.
Meanwhile, four in five Republicans say she would be a "poor" or "terrible" president" (79%), while half of whites rate her just as negatively.
| Great/Good | Average | Poor/Terrible | |||||||||||||||||||||||||||||||||||||||||||||||||||||||||||||||||||||||||||||||||||||||||||||||||
|---|---|---|---|---|---|---|---|---|---|---|---|---|---|---|---|---|---|---|---|---|---|---|---|---|---|---|---|---|---|---|---|---|---|---|---|---|---|---|---|---|---|---|---|---|---|---|---|---|---|---|---|---|---|---|---|---|---|---|---|---|---|---|---|---|---|---|---|---|---|---|---|---|---|---|---|---|---|---|---|---|---|---|---|---|---|---|---|---|---|---|---|---|---|---|---|---|---|---|---|
| % | % | % | |||||||||||||||||||||||||||||||||||||||||||||||||||||||||||||||||||||||||||||||||||||||||||||||||
| Men | 29 | 23 | 42 | ||||||||||||||||||||||||||||||||||||||||||||||||||||||||||||||||||||||||||||||||||||||||||||||||
| Women | 36 | 18 | 37 | ||||||||||||||||||||||||||||||||||||||||||||||||||||||||||||||||||||||||||||||||||||||||||||||||
| White | 24 | 18 | 50 | ||||||||||||||||||||||||||||||||||||||||||||||||||||||||||||||||||||||||||||||||||||||||||||||||
| Nonwhite | 50 | 23 | 15 | ||||||||||||||||||||||||||||||||||||||||||||||||||||||||||||||||||||||||||||||||||||||||||||||||
| 18-34 | 27 | 29 | 33 | ||||||||||||||||||||||||||||||||||||||||||||||||||||||||||||||||||||||||||||||||||||||||||||||||
| 35-54 | 31 | 21 | 37 | ||||||||||||||||||||||||||||||||||||||||||||||||||||||||||||||||||||||||||||||||||||||||||||||||
| 55+ | 38 | 14 | 44 | ||||||||||||||||||||||||||||||||||||||||||||||||||||||||||||||||||||||||||||||||||||||||||||||||
| Republicans | 3 | 11 | 79 | ||||||||||||||||||||||||||||||||||||||||||||||||||||||||||||||||||||||||||||||||||||||||||||||||
| Independents | 22 | 27 | 38 | ||||||||||||||||||||||||||||||||||||||||||||||||||||||||||||||||||||||||||||||||||||||||||||||||
| Democrats | 69 | 19 | 6 | ||||||||||||||||||||||||||||||||||||||||||||||||||||||||||||||||||||||||||||||||||||||||||||||||
| Gallup, Sept. 14-18, 2016 | |||||||||||||||||||||||||||||||||||||||||||||||||||||||||||||||||||||||||||||||||||||||||||||||||||
Republicans' Ratings for Trump Lower Than Democrats' for Clinton
Trump's ratings from his own party are somewhat more subdued than Clinton's among her own party -- 59% of Republicans say he would be a "great" or "good" president compared with 69% of Democrats who say the same for Clinton. In no other group does the percentage saying Trump would be a good or great president reach a majority, though about one in three whites (32%) and adults over the age of 55 (32%) have a positive view of Trump as president.
Democrats overwhelmingly view a Trump presidency as "poor" or "terrible" (84%), slightly higher than the percentage of Republicans who view a potential Clinton presidency as poor or terrible. More than six in 10 nonwhites (66%) and 18- to 34-year-olds (61%) share this sentiment. Smaller majorities of women (54%) and independents (51%) are just as negative about a potential Trump presidency.
| Great/Good | Average | Poor/Terrible | |||||||||||||||||||||||||||||||||||||||||||||||||||||||||||||||||||||||||||||||||||||||||||||||||
|---|---|---|---|---|---|---|---|---|---|---|---|---|---|---|---|---|---|---|---|---|---|---|---|---|---|---|---|---|---|---|---|---|---|---|---|---|---|---|---|---|---|---|---|---|---|---|---|---|---|---|---|---|---|---|---|---|---|---|---|---|---|---|---|---|---|---|---|---|---|---|---|---|---|---|---|---|---|---|---|---|---|---|---|---|---|---|---|---|---|---|---|---|---|---|---|---|---|---|---|
| % | % | % | |||||||||||||||||||||||||||||||||||||||||||||||||||||||||||||||||||||||||||||||||||||||||||||||||
| Men | 28 | 17 | 49 | ||||||||||||||||||||||||||||||||||||||||||||||||||||||||||||||||||||||||||||||||||||||||||||||||
| Women | 22 | 13 | 54 | ||||||||||||||||||||||||||||||||||||||||||||||||||||||||||||||||||||||||||||||||||||||||||||||||
| White | 32 | 14 | 45 | ||||||||||||||||||||||||||||||||||||||||||||||||||||||||||||||||||||||||||||||||||||||||||||||||
| Nonwhite | 8 | 15 | 66 | ||||||||||||||||||||||||||||||||||||||||||||||||||||||||||||||||||||||||||||||||||||||||||||||||
| 18-34 | 12 | 16 | 61 | ||||||||||||||||||||||||||||||||||||||||||||||||||||||||||||||||||||||||||||||||||||||||||||||||
| 35-54 | 26 | 13 | 50 | ||||||||||||||||||||||||||||||||||||||||||||||||||||||||||||||||||||||||||||||||||||||||||||||||
| 55+ | 32 | 15 | 46 | ||||||||||||||||||||||||||||||||||||||||||||||||||||||||||||||||||||||||||||||||||||||||||||||||
| Republicans | 59 | 19 | 14 | ||||||||||||||||||||||||||||||||||||||||||||||||||||||||||||||||||||||||||||||||||||||||||||||||
| Independents | 18 | 17 | 51 | ||||||||||||||||||||||||||||||||||||||||||||||||||||||||||||||||||||||||||||||||||||||||||||||||
| Democrats | 3 | 8 | 84 | ||||||||||||||||||||||||||||||||||||||||||||||||||||||||||||||||||||||||||||||||||||||||||||||||
| Gallup, Sept. 14-18, 2016 | |||||||||||||||||||||||||||||||||||||||||||||||||||||||||||||||||||||||||||||||||||||||||||||||||||
Bottom Line
The past four months have been eventful for the presidential race, but clearly not consequential in terms of Americans' outlooks for either a Clinton or Trump presidency.
The public is no more likely to view a Clinton presidency positively than in May, but fewer now have negative expectations if she were to win. But views of a Trump White House have hardly budged, and a majority continues to think he would be a poor or terrible president.
Beyond the two candidates' respective political parties, no demographic group has high expectations for either of their possible performances as president -- though Clinton does receive positive ratings from half of nonwhites. This underscores the incredibly negative tone of the race and how difficult it will be for either candidate to overcome such dismal assessments from Americans with less than two months left before Election Day.
Enthusiasm for either Clinton or Trump in the White House remains fairly subdued, which raises the stakes for their performance in the debates and in the final weeks of the campaign.
Historical data are available in Gallup Analytics.
Survey Methods
Results for this Gallup poll are based on telephone interviews conducted Sept. 14-18, 2016, with a random sample of 1,033 adults, aged 18 and older, living in all 50 U.S. states and the District of Columbia. For results based on the total sample of national adults, the margin of sampling error is ±4 percentage points at the 95% confidence level. All reported margins of sampling error include computed design effects for weighting.
Each sample of national adults includes a minimum quota of 60% cellphone respondents and 40% landline respondents, with additional minimum quotas by time zone within region. Landline and cellular telephone numbers are selected using random-digit-dial methods.
Learn more about how the Gallup Poll Social Series works.