Story Highlights
- Job Creation Index matches high of +33
- Index hits high mark for sixth time in past seven months
- South shows strongest level of job creation
WASHINGTON, D.C. -- Job creation in the U.S. stayed strong in November. Gallup's U.S. Job Creation Index, a measure of hiring activity that began in January 2008, tied its high of +33 and remained similar to October's score of +32.
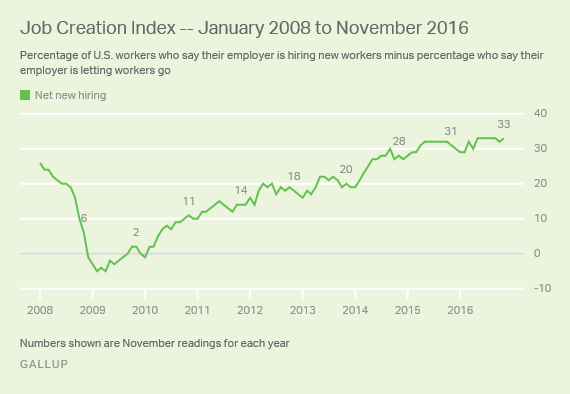
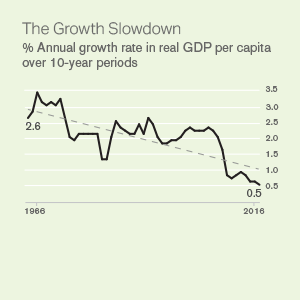
After collapsing from its inaugural measure of +26 in January 2008 to -5 in February 2009, the index mostly increased over the next six years, reaching a new high of +32 in May 2015. Since then, the index has been steady at this level, with all but two of the past 18 months registering between +30 and +33.
Gallup's Job Creation Index is based on employed U.S. adults' perceptions of their companies' hiring and firing activity. Gallup asks a random sample of employed adults each day whether their employer is hiring new people and expanding the size of its workforce, not changing the size of its workforce, or letting people go and reducing the size of its workforce. The resulting index -- computed by subtracting the percentage of employers letting workers go (10%) from the percentage hiring (43%) -- is a nearly real-time indicator of the nation's employment picture across all industry and business sectors.
November Job Creation Was Strongest in South
All four of the nation's major regions had a Job Creation Index score at +30 or above last month, with only the South showing some growth. The South went from having the lowest regional index score (+30) in October to having the highest score (+35) in November. The South's index score also increased the most from its November 2015 score.
| Nov 2015 | Oct 2016 | Nov 2016 | |||||||||||||||||||||||||||||||||||||||||||||||||||||||||||||||||||||||||||||||||||||||||||||||||
|---|---|---|---|---|---|---|---|---|---|---|---|---|---|---|---|---|---|---|---|---|---|---|---|---|---|---|---|---|---|---|---|---|---|---|---|---|---|---|---|---|---|---|---|---|---|---|---|---|---|---|---|---|---|---|---|---|---|---|---|---|---|---|---|---|---|---|---|---|---|---|---|---|---|---|---|---|---|---|---|---|---|---|---|---|---|---|---|---|---|---|---|---|---|---|---|---|---|---|---|
| U.S. | +31 | +32 | +33 | ||||||||||||||||||||||||||||||||||||||||||||||||||||||||||||||||||||||||||||||||||||||||||||||||
| East | +30 | +31 | +30 | ||||||||||||||||||||||||||||||||||||||||||||||||||||||||||||||||||||||||||||||||||||||||||||||||
| Midwest | +31 | +33 | +33 | ||||||||||||||||||||||||||||||||||||||||||||||||||||||||||||||||||||||||||||||||||||||||||||||||
| South | +30 | +30 | +35 | ||||||||||||||||||||||||||||||||||||||||||||||||||||||||||||||||||||||||||||||||||||||||||||||||
| West | +32 | +35 | +33 | ||||||||||||||||||||||||||||||||||||||||||||||||||||||||||||||||||||||||||||||||||||||||||||||||
| Gallup Daily tracking | |||||||||||||||||||||||||||||||||||||||||||||||||||||||||||||||||||||||||||||||||||||||||||||||||||
Looking at overall averages for the past year, the West and Midwest are highest at +33, followed by the South at +31 and the East at +30. The South and East also lagged behind the West and Midwest in the yearly averages for 2014 and 2015.
Bottom Line
Workers in the U.S. continued to report far more hiring than firing going on in their workplaces in November, and it now appears almost certain that 2016 will have the highest annual average Job Creation Index score since Gallup first measured it in January 2008. Gallup's unadjusted unemployment rate and the Gallup Good Jobs rate for November also showed strength on the U.S. employment front.
If recent seasonal patterns hold, the next few months could produce a dip in job creation. In the past two years, six of the eight lowest Job Creation Index scores have come in December through February. But the drops were relatively minor and in each year, the scores rose to record highs by May.
Survey Methods
Results for this Gallup poll are based on telephone interviews conducted Nov. 1-29, 2016, on the Gallup U.S. Daily survey, with a random sample of 16,407 workers, aged 18 and older, living in all 50 U.S. states and the District of Columbia. For results based on the total sample of employed adults, the margin of sampling error is ±1 percentage point at the 95% confidence level. All reported margins of sampling error include computed design effects for weighting.
Each sample of national adults includes a minimum quota of 60% cellphone respondents and 40% landline respondents, with additional minimum quotas by time zone within region. Landline and cellular telephone numbers are selected using random-digit-dial methods.
Learn more about how the Gallup U.S. Daily works.