Story Highlights
- GGJ rate of 44.7% down year-on-year for first time since April 2014
- Unemployment up 0.3 points to 5.2%
- Workforce participation falls to 66.5%
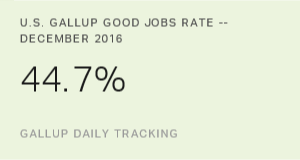
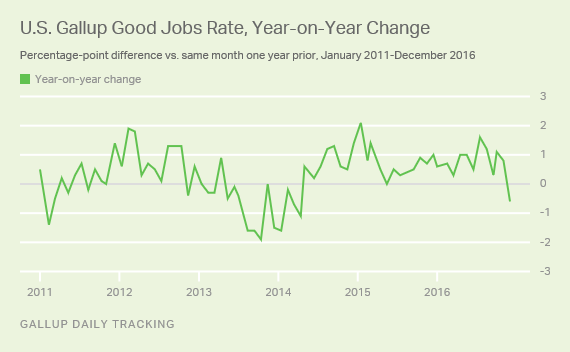
WASHINGTON, D.C. -- The Gallup Good Jobs (GGJ) rate in the U.S. was 44.7% in December, down from 45.7% in November. While the GGJ rate often declines somewhat in December, this represents the first month with a year-on-year decrease since April 2014. The U.S. GGJ rate was 45.3% in December 2015.
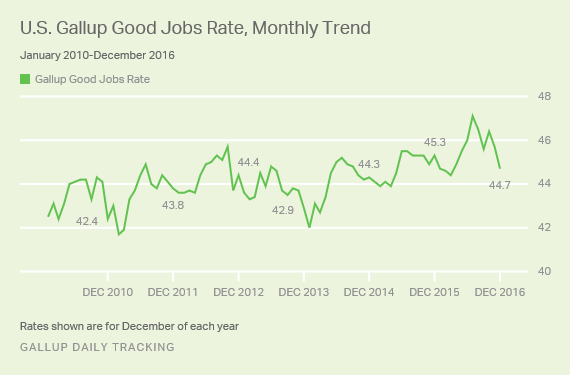
The December GGJ rate is down from the record high of 47.1% in July. GGJ typically peaks in June and July with summer employment and then drops in the fourth quarter, with a limited uptick in October. November's 0.7-percentage-point decrease to 45.7% fit this pattern, but the one-point drop in December is large relative to Decembers in the past several years.
The latest results are based on Gallup Daily tracking interviews with more than 27,000 Americans, conducted Dec. 1-29 by landline telephone and cellphone. The GGJ metric tracks the percentage of U.S. adults, aged 18 and older, who work for an employer full time -- at least 30 hours per week. Gallup does not count adults who are self-employed, who work fewer than 30 hours per week, who are unemployed or who are out of the workforce as payroll-employed in the GGJ metric. The Gallup Good Jobs metric does not take into account factors such as job satisfaction or salary level, and solely reflects full-time employment for an employer. GGJ is not seasonally adjusted.
Gallup first measured the GGJ rate in January 2010, a time of high unemployment (10.9%). At that time, 42.5% of Americans were employed full time by an employer. GGJ fell as low as 41.7% in February 2011 but improved over the next few months. Before this year, the previous high point was 45.7% in October 2012.
Since January 2010, GGJ has generally trended upward, apart from the period spanning November 2012 to April 2014, when the measure typically registered year-over-year decreases. Since May 2014, the GGJ rate once again has registered year-over-year increases in almost every month until now.
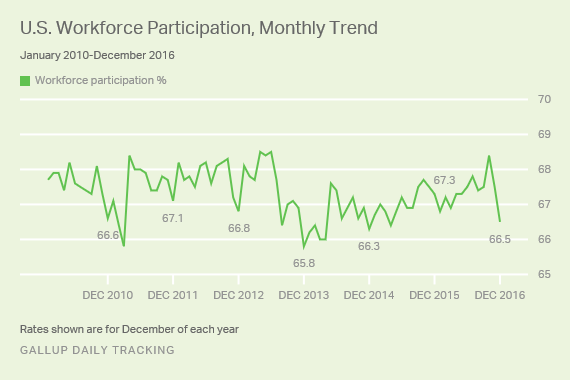
Workforce Participation Falls to 66.5% in December
The percentage of U.S. adults who participated in the workforce in December in any capacity -- by working full time, working part time, or not working but actively seeking and being available for work -- was 66.5%, down a full point from 67.5% in November and the lowest recorded since April 2015.
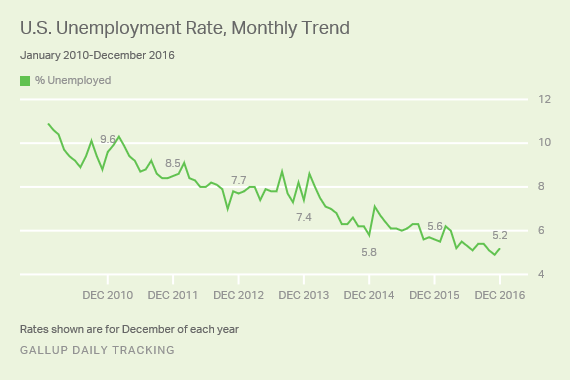
Unemployment Rate Up Slightly to 5.2%
Gallup's unadjusted U.S. unemployment rate in December was 5.2%, edging up from 4.9% in November. Gallup's U.S. unemployment rate represents the percentage of adults in the workforce who did not have any paid work in the past seven days, either for an employer or for themselves, and who were actively looking for and available to work.
Unlike the Gallup Good Jobs rate, which is a percentage of the total population, the unemployment rates that Gallup and the U.S. Bureau of Labor Statistics (BLS) report are percentages of the labor force, defined as those who are working or seeking work. While both Gallup and BLS data are based on surveys with large sample sizes, the two have important methodological differences outlined at the end of this article. Additionally, the most-discussed unemployment rate released by the BLS each month is seasonally adjusted, while Gallup reports unadjusted numbers. Although Gallup's unemployment numbers strongly correlate with BLS rates, the BLS and Gallup estimates of unemployment do not always track precisely on a monthly basis.
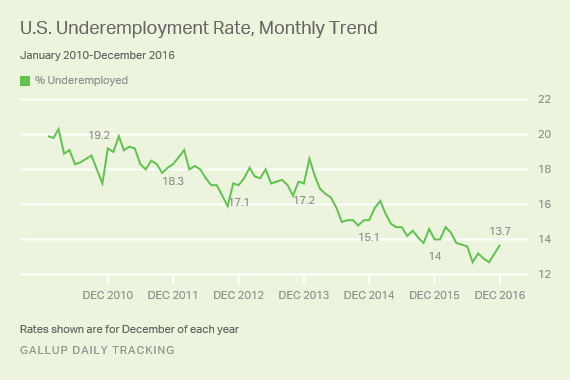
Underemployment Rises to 13.7%
Gallup's measure of underemployment in December was 13.7%, up half a point from 13.2% in November, and a full point from the rate measured in October (12.7%). Gallup's U.S. underemployment rate combines the percentage of adults in the workforce who are unemployed (5.2%) with those who are working part time but desire full-time work (8.5%). Underemployment was roughly 20% when Gallup started measuring it in January 2010.
Bottom Line
Gallup's 44.7% Good Jobs rate in December 2016 represents a decrease in GGJ beyond typical seasonal effects. This continues a decline from October, when GGJ stood at 46.4%, 1.7 points higher than this past month. Over the same period, workforce participation has fallen almost two points, from 68.4% to 66.5%, and involuntary part-time work has ticked up almost one point, from 7.6% to 8.5%.
The labor market typically softens in winter each year, so the direction of these changes is not unexpected. However, the past two months taken together have shown a stronger-than-average decline compared with Gallup's measurements from 2010-2015.
Gallup has seen a sharp year-end drop in GGJ of this magnitude twice before, in 2012 and 2013. After the 2012 election, GGJ fell and languished for over a year. After falling again in the final months of 2013, however, GGJ began slowly trending upward until this past month. It remains to be seen which path the GGJ will follow in 2017.
The data in this article are available in Gallup Analytics.
| Most recent month (Dec 2016) | Previous month (Nov 2016) | Month a year ago (Dec 2015) | |||||||||||||||||||||||||||||||||||||||||||||||||||||||||||||||||||||||||||||||||||||||||||||||||
|---|---|---|---|---|---|---|---|---|---|---|---|---|---|---|---|---|---|---|---|---|---|---|---|---|---|---|---|---|---|---|---|---|---|---|---|---|---|---|---|---|---|---|---|---|---|---|---|---|---|---|---|---|---|---|---|---|---|---|---|---|---|---|---|---|---|---|---|---|---|---|---|---|---|---|---|---|---|---|---|---|---|---|---|---|---|---|---|---|---|---|---|---|---|---|---|---|---|---|---|
| % | % | % | |||||||||||||||||||||||||||||||||||||||||||||||||||||||||||||||||||||||||||||||||||||||||||||||||
| Employed full time for employer (GGJ)* | 44.7 | 45.7 | 45.3 | ||||||||||||||||||||||||||||||||||||||||||||||||||||||||||||||||||||||||||||||||||||||||||||||||
| Employed full time for self* | 5.5 | 5.5 | 5.3 | ||||||||||||||||||||||||||||||||||||||||||||||||||||||||||||||||||||||||||||||||||||||||||||||||
| Workforce participation rate* | 66.5 | 67.5 | 67.3 | ||||||||||||||||||||||||||||||||||||||||||||||||||||||||||||||||||||||||||||||||||||||||||||||||
| Unemployment rate ** | 5.2 | 4.9 | 5.6 | ||||||||||||||||||||||||||||||||||||||||||||||||||||||||||||||||||||||||||||||||||||||||||||||||
| Employed part time, wanting full time** | 8.5 | 8.3 | 8.3 | ||||||||||||||||||||||||||||||||||||||||||||||||||||||||||||||||||||||||||||||||||||||||||||||||
| Underemployment rate** | 13.7 | 13.2 | 14.0 | ||||||||||||||||||||||||||||||||||||||||||||||||||||||||||||||||||||||||||||||||||||||||||||||||
| *Metrics represent percentages of the population aged 18+ who have a job or are actively seeking work. **Metrics represent percentages of the workforce. | |||||||||||||||||||||||||||||||||||||||||||||||||||||||||||||||||||||||||||||||||||||||||||||||||||
| Gallup Daily | |||||||||||||||||||||||||||||||||||||||||||||||||||||||||||||||||||||||||||||||||||||||||||||||||||
| GALLUP | U.S. Bureau of Labor Statistics | ||||||||||||||||||||||||||||||||||||||||||||||||||||||||||||||||||||||||||||||||||||||||||||||||||
|---|---|---|---|---|---|---|---|---|---|---|---|---|---|---|---|---|---|---|---|---|---|---|---|---|---|---|---|---|---|---|---|---|---|---|---|---|---|---|---|---|---|---|---|---|---|---|---|---|---|---|---|---|---|---|---|---|---|---|---|---|---|---|---|---|---|---|---|---|---|---|---|---|---|---|---|---|---|---|---|---|---|---|---|---|---|---|---|---|---|---|---|---|---|---|---|---|---|---|---|
| Population | 18 and older | 16 and older | |||||||||||||||||||||||||||||||||||||||||||||||||||||||||||||||||||||||||||||||||||||||||||||||||
| Adjustments | Not seasonally adjusted | Seasonally adjusted | |||||||||||||||||||||||||||||||||||||||||||||||||||||||||||||||||||||||||||||||||||||||||||||||||
| Sample size | 30,000 individuals per month | 60,000 households per month | |||||||||||||||||||||||||||||||||||||||||||||||||||||||||||||||||||||||||||||||||||||||||||||||||
| Mode of interview | RDD telephone, including cellphones | Rotating panel with face-to-face and telephone interviewing | |||||||||||||||||||||||||||||||||||||||||||||||||||||||||||||||||||||||||||||||||||||||||||||||||
| Data collection period | Continuous | One-week reference period during mid-month | |||||||||||||||||||||||||||||||||||||||||||||||||||||||||||||||||||||||||||||||||||||||||||||||||
| Reporting frequency | Daily, weekly and monthly, based on 30-day rolling averages | Monthly, based on one-week reference period | |||||||||||||||||||||||||||||||||||||||||||||||||||||||||||||||||||||||||||||||||||||||||||||||||
| Gallup | |||||||||||||||||||||||||||||||||||||||||||||||||||||||||||||||||||||||||||||||||||||||||||||||||||
Gallup.com reports results from these indexes in daily, weekly and monthly averages and in Gallup.com stories. Complete trend data are always available to view in the following charts:
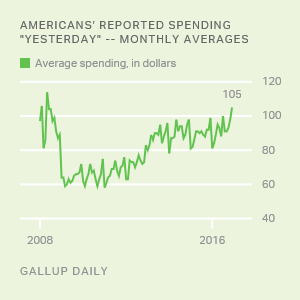
Daily: Employment, Economic Confidence, Consumer Spending
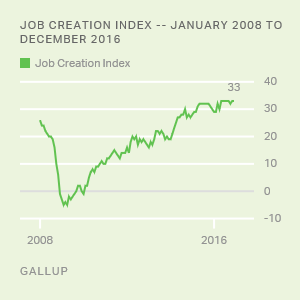
Weekly: Employment, Economic Confidence, Job Creation, Consumer Spending
Read more about Gallup's economic measures.
View our economic release schedule.
Survey Methods
Results for this Gallup poll are based on telephone interviews conducted Dec. 1-29, 2016, on the Gallup U.S. Daily survey, with a random sample of 27,336 adults, aged 18 and older, living in all 50 U.S. states and the District of Columbia. For results based on the total sample of national adults, the margin of sampling error is ±1 percentage point at the 95% confidence level. All reported margins of sampling error include computed design effects for weighting.
Each sample of national adults includes a minimum quota of 60% cellphone respondents and 40% landline respondents, with additional minimum quotas by time zone within region. Landline and cellular telephone numbers are selected using random-digit-dial methods.
Learn more about how the Gallup U.S. Daily works.