Story Highlights
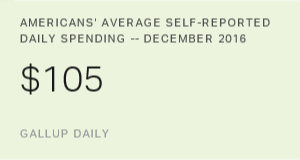
- $105 daily average for the month tops December 2015's $99
- Average is highest for any month since $114 in May 2008
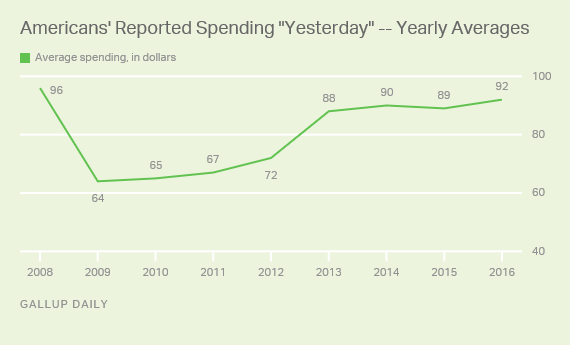
- Daily reports averaged $92 for all of 2016, highest since 2008
WASHINGTON, D.C. -- Americans' annual end-of-the-year holiday shopping spree boosted Gallup's daily measure of consumer spending to the highest average for any December since Gallup began tracking spending in 2008. The self-reported daily average of $105 is a $7 increase from $98 in November and a $6 hike from $99 last December.
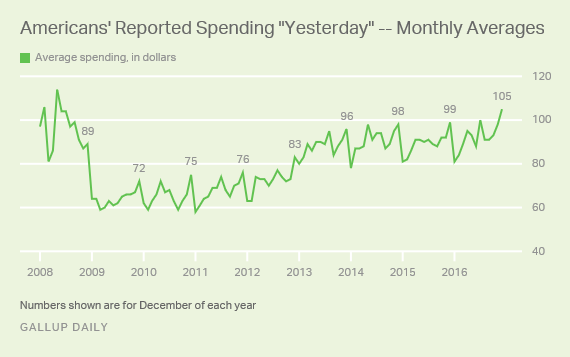
The $105 average for December is also the highest for any month since May 2008 ($114), when spending may have been boosted by government-issued rebate checks designed to stimulate the economy. The economy crashed later that year, and consumers responded by slashing daily spending over the next several months.
The December average is based on more than 13,500 interviews conducted as part of Gallup Daily tracking throughout December. Gallup asks Americans each night to report how much they spent the previous day, excluding normal household bills and major purchases such as a home or car. The measure gives an indication of discretionary spending.
Average for 2016 Highest Since 2008
December marks the third consecutive month and the fifth month this year (March and April) that the daily spending average has matched or exceeded the highest average for that month in Gallup's trend. The $92 overall average for 2016 is still slightly below 2008's average of $96, but higher than any year since.
Affluent Americans' purchases drove last month's rise in spending. Households with annual incomes of $90,000 or more increased their daily spending from an average of $146 in November to $170 in December, while those earning less than $90,000 averaged $82 in both months. Overall, spending increased slightly more from the start of the year to the end in lower-income households -- a 30% increase from January's average to December's in households with incomes below $90,000, compared with a 27% increase in households with incomes of $90,000 or more.
After December Increase, January Decrease Expected
December spending -- driven by Christmas shopping, travel and other holiday-related expenses -- has produced the highest-spending month every year since 2009. Conversely, January has been among the lowest-spending months, and over the last eight years, daily spending has averaged a drop of $15 from December to January. The pattern of rising spending from October through December followed by a double-digit drop in January has held steady over the last three years.
| October | November | December | January | ||||||||||||||||||||||||||||||||||||||||||||||||||||||||||||||||||||||||||||||||||||||||||||||||
|---|---|---|---|---|---|---|---|---|---|---|---|---|---|---|---|---|---|---|---|---|---|---|---|---|---|---|---|---|---|---|---|---|---|---|---|---|---|---|---|---|---|---|---|---|---|---|---|---|---|---|---|---|---|---|---|---|---|---|---|---|---|---|---|---|---|---|---|---|---|---|---|---|---|---|---|---|---|---|---|---|---|---|---|---|---|---|---|---|---|---|---|---|---|---|---|---|---|---|---|
| $ | $ | $ | $ | ||||||||||||||||||||||||||||||||||||||||||||||||||||||||||||||||||||||||||||||||||||||||||||||||
| 2016 | 93 | 98 | 105 | N/A (2017) | |||||||||||||||||||||||||||||||||||||||||||||||||||||||||||||||||||||||||||||||||||||||||||||||
| 2015 | 92 | 92 | 99 | 81 (2016) | |||||||||||||||||||||||||||||||||||||||||||||||||||||||||||||||||||||||||||||||||||||||||||||||
| 2014 | 89 | 95 | 98 | 81 (2015) | |||||||||||||||||||||||||||||||||||||||||||||||||||||||||||||||||||||||||||||||||||||||||||||||
| 2013 | 88 | 91 | 96 | 78 (2014) | |||||||||||||||||||||||||||||||||||||||||||||||||||||||||||||||||||||||||||||||||||||||||||||||
| Gallup Daily | |||||||||||||||||||||||||||||||||||||||||||||||||||||||||||||||||||||||||||||||||||||||||||||||||||
Bottom Line
Consumer spending concluded its strong 2016 showing with a robust finish in December. As a result, the annual average of daily spending reports increased in 2016 after failing to rise in 2015 for the first time in six years.
Gallup's consumer spending measure in the early months of 2008 has provided a key benchmark of how well Americans have recovered from the economic crash that engulfed the U.S. that year. This year's Gallup polling has produced two strong pieces of evidence that American consumers are increasingly willing to engage in discretionary spending:
- Daily spending averaged $100 in July and $105 in December, the first months that spending has reached the $100 level in any month since July 2008, just before the financial crisis.
- The annual average for daily spending in 2016 exceeded $90 for the first time since 2008, climbing within $4 of the $96 average for that year.
These data are available in Gallup Analytics.
Gallup.com reports results from these indexes in daily, weekly and monthly averages and in Gallup.com stories. Complete trend data are always available to view in the following charts:
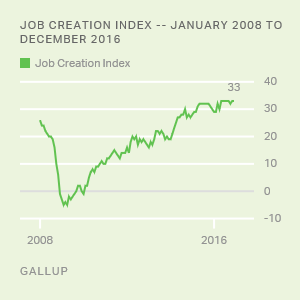
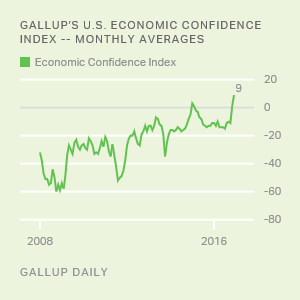
Daily: Employment, Economic Confidence, Consumer Spending
Weekly: Employment, Economic Confidence, Job Creation, Consumer Spending
Read more about Gallup's economic measures.
View our economic release schedule.
Survey Methods
Results for this Gallup poll are based on telephone interviews conducted Dec. 1-6, Dec. 8-23, and Dec. 26-30, 2016, on the Gallup Daily tracking survey, with a random sample of 13,662 adults, aged 18 and older, living in all 50 U.S. states and the District of Columbia. For results based on the total sample of national adults, the margin of sampling error is ±$5 at the 95% confidence level. All reported margins of sampling error include computed design effects for weighting.
Each sample of national adults includes a minimum quota of 60% cellphone respondents and 40% landline respondents, with additional minimum quotas by time zone within region. Landline and cellular telephone numbers are selected using random-digit-dial methods.
Learn more about how Gallup Daily tracking works.