Story Highlights
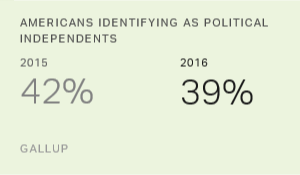
- 39% of Americans identified as independents in 2016
- First time below 40% since 2010
- Democrats maintain advantage in party affiliation accounting for leanings
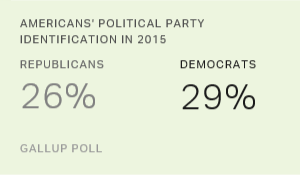
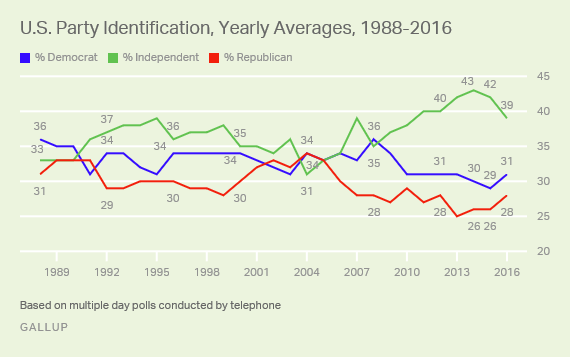
PRINCETON, N.J. -- An average of 39% of Americans self-identified as political independents in 2016, down from 42% in 2015 and reaching its lowest point in six years. Meanwhile, identification with both major parties edged up, with Democrats continuing to maintain a slight advantage over Republicans, 31% to 28%.
The results are based on combined data from multiday Gallup polls conducted throughout 2016, including more than 17,000 interviews with U.S. adults aged 18 and older.
After ranging between 31% and 39% in Gallup's telephone polling data starting in the late 1980s, the percentage of independents reached 40% in 2011 and remained near that level through 2015 -- including a high of 43% in 2014. But in 2016, independent identification dropped three percentage points from its 2015 reading, falling below the 40% mark.
Gallup has measured similar declines in the percentage of independents in most other recent presidential election years, except in 1992 and 2012. On average, the decline has been three points. The visibility the presidential campaign gives to the two major parties, and the resulting attachment Americans may feel to the party of their preferred candidate, may explain this cyclical drop in the percentage of independents.
| Year Before Election | Election Year | Change | |||||||||||||||||||||||||||||||||||||||||||||||||||||||||||||||||||||||||||||||||||||||||||||||||
|---|---|---|---|---|---|---|---|---|---|---|---|---|---|---|---|---|---|---|---|---|---|---|---|---|---|---|---|---|---|---|---|---|---|---|---|---|---|---|---|---|---|---|---|---|---|---|---|---|---|---|---|---|---|---|---|---|---|---|---|---|---|---|---|---|---|---|---|---|---|---|---|---|---|---|---|---|---|---|---|---|---|---|---|---|---|---|---|---|---|---|---|---|---|---|---|---|---|---|---|
| % | % | pct. pts. | |||||||||||||||||||||||||||||||||||||||||||||||||||||||||||||||||||||||||||||||||||||||||||||||||
| 2016 | 42 | 39 | -3 | ||||||||||||||||||||||||||||||||||||||||||||||||||||||||||||||||||||||||||||||||||||||||||||||||
| 2012 | 40 | 40 | 0 | ||||||||||||||||||||||||||||||||||||||||||||||||||||||||||||||||||||||||||||||||||||||||||||||||
| 2008 | 39 | 35 | -4 | ||||||||||||||||||||||||||||||||||||||||||||||||||||||||||||||||||||||||||||||||||||||||||||||||
| 2004 | 36 | 31 | -5 | ||||||||||||||||||||||||||||||||||||||||||||||||||||||||||||||||||||||||||||||||||||||||||||||||
| 2000 | 39 | 35 | -4 | ||||||||||||||||||||||||||||||||||||||||||||||||||||||||||||||||||||||||||||||||||||||||||||||||
| 1996 | 39 | 36 | -3 | ||||||||||||||||||||||||||||||||||||||||||||||||||||||||||||||||||||||||||||||||||||||||||||||||
| 1992 | 36 | 37 | +1 | ||||||||||||||||||||||||||||||||||||||||||||||||||||||||||||||||||||||||||||||||||||||||||||||||
| Gallup | |||||||||||||||||||||||||||||||||||||||||||||||||||||||||||||||||||||||||||||||||||||||||||||||||||
Even with the expected drop in 2016, independent identification remains above its 37% average since 1988.
Both parties gained similar percentages of supporters last year to offset the decrease in independents. Republican identification moved from 26% to 28%, and Democratic identification increased from 29% to 31%. Typically, both parties have seen at least minimal gains in identification in presidential election years, rather than an increase for just one party.
After the 2016 increases, both major parties remain two percentage points below their averages since 1988. Over that time, an average of 33% of Americans have identified as Democrats and 30% as Republicans.
Democratic Advantage Expands to Five Points Accounting for Independent Leanings
Many Americans who initially identify as independents reveal a "leaning" toward one of the major parties when probed. Gallup has regularly measured independents' party leanings since 1991. In 2016, a total of 47% of Americans either identified as Democrats outright or said they were independent but leaned to the Democratic Party. That compares with 42% who identified as Republicans or said they leaned to the Republican Party.
The high point in Democratic affiliation occurred in 2008 when the party held a 12-point advantage (52% to 40%). Republicans' biggest advantage -- the only time it has held an advantage in Gallup's trend -- occurred in 1991 after the Persian Gulf War, at 48% to 44%. Republicans have tied or nearly tied Democrats in several years, including in 2001-2003 after the 9/11 terrorist attacks and in 2010-2011 after Obamacare was passed.
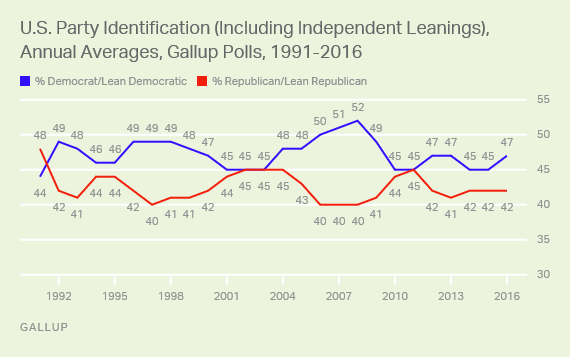
The 2016 average, however, obscures the fact that Democrats had a larger advantage over Republicans earlier in 2016 than they did later in the year. Democrats averaged three-point advantages in the third (46% to 43%) and fourth (45% to 42%) quarters of 2016. The latter period included the election, won by Republican Donald Trump in the Electoral College even though Democrat Hillary Clinton won the popular vote by over two percentage points.
It is not uncommon for party preferences to shift over the course of a presidential election year, with the movement typically in the direction of the winning party.
Implications
Political independents continue to outnumber Democrats and Republicans in the U.S. by a significant margin. While the percentage of independents fell in the presidential election year, as it often does, it remains higher than it was in the 1990s and 2000s.
Independent identification usually increases in the year after a presidential election year but typically does not simply revert to its previous level. Rather, the average increase in independents in the year after a presidential election is one percentage point. If that pattern holds, it would be enough to put the percentage of independents back above 40% in 2017, but not back to the higher levels of 2013-2015.
Separately, Gallup finds that Americans continue to give higher unfavorable than favorable ratings to both parties, which had not been the case until 2010. Much of that change could be tied to frustration with the way the government is functioning -- particularly the partisan gridlock that seemingly prevents the federal government from addressing major issues facing the country.
Thus, while the presidential election encourages a greater number of Americans to identify with one of the major parties, the effects usually recede in the year after it as the parties are unable to consolidate their short-term gains. This challenge is even greater at a time when Americans have such negative opinions of both parties.
Historical data are available in Gallup Analytics.
Survey Methods
Results for this Gallup poll are based on combined data from telephone interviews conducted throughout 2016, with a random sample of 17,375 adults, aged 18 and older, living in all 50 U.S. states and the District of Columbia. For results based on the total sample of national adults, the margin of sampling error is ±1 percentage points at the 95% confidence level. All reported margins of sampling error include computed design effects for weighting.
Each sample of national adults includes a minimum quota of 60% cellphone respondents and 40% landline respondents, with additional minimum quotas by time zone within region. Landline and cellular telephone numbers are selected using random-digit-dial methods.
Learn more about how the Gallup Poll Social Series works.