Story Highlights
- GGJ at highest rate for any January since 2010
- Unemployment up to 5.8%, in line with seasonal patterns
- Workforce participation rebounds to 67.4% from the December low
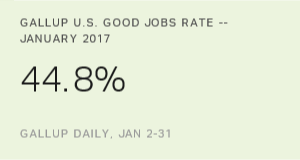
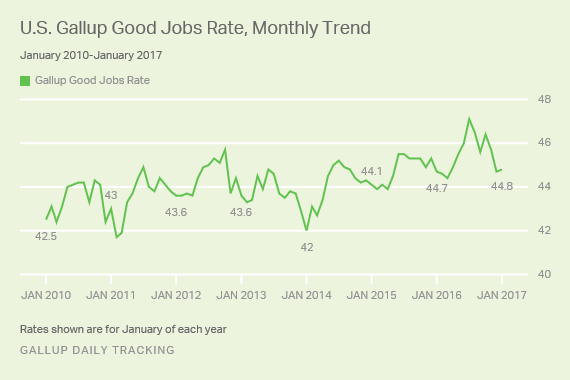
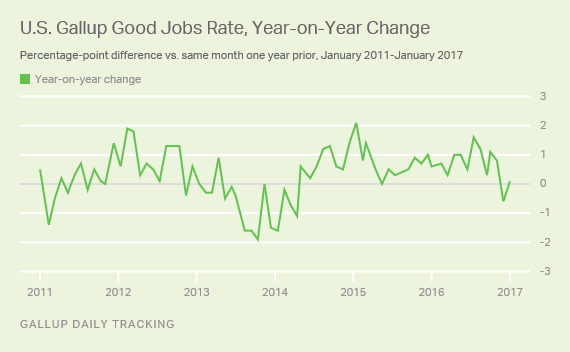
WASHINGTON, D.C. -- The Gallup Good Jobs (GGJ) rate in the U.S. was 44.8% in January, up one-tenth of a point from 44.7% in December. While this is not a statistically significant increase, the current rate is the highest for any January since Gallup began tracking the measure in 2010. One year ago this month, the U.S. GGJ rate was 44.7%.
The latest results are based on Gallup Daily tracking interviews with 29,456 Americans, conducted Jan. 2-31 by landline telephone and cellphone. The GGJ metric tracks the percentage of U.S. adults, aged 18 and older, who work for an employer full time -- at least 30 hours per week. Gallup does not count adults who are self-employed, who work fewer than 30 hours per week, who are unemployed or who are out of the workforce as payroll-employed in the GGJ metric. The Gallup Good Jobs metric does not take into account factors such as job satisfaction or salary level and solely reflects full-time employment for an employer. GGJ is not seasonally adjusted.
Gallup first measured the GGJ rate in January 2010 when unemployment was still quite high coming out of the 2007-2009 recession (10.9%). At that time, 42.5% of Americans were employed full time by an employer. GGJ fell as low as 41.7% in February 2011, but improved over the next few months. The highest monthly GGJ rate Gallup has measured was 47.1% in July 2016.
Since its inception, GGJ has generally trended upward, apart from the period spanning December 2012 to April 2014, when the measure registered year-over-year decreases. Since May 2014, the GGJ rate once again has registered year-over-year increases in almost every month.
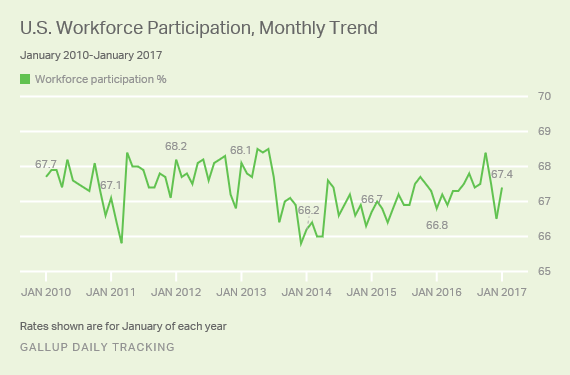
Workforce Participation Rebounds to 67.4% in January
The percentage of U.S. adults who participated in the workforce in January in any capacity -- by working full time, working part time, or not working but actively seeking and being available for work -- was 67.4%. This was up almost a full percentage point from 66.5% in December and is statistically even with the rate measured in November 2016 (67.5%).
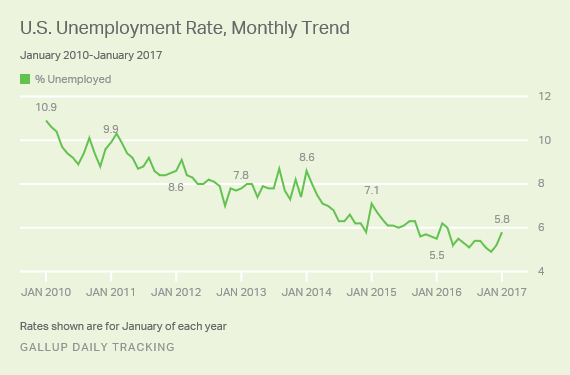
Unemployment Rate Rises Slightly Again to 5.8%
Gallup's unadjusted U.S. unemployment rate in January was 5.8%, up from 5.2% in December, and 4.9% in November 2016 -- the lowest rate Gallup has recorded. Gallup's U.S. unemployment rate represents the percentage of adults in the workforce who did not have any paid work in the past seven days, either for an employer or for themselves, and who were actively looking for and available to work.
Unlike the Gallup Good Jobs rate, which is a percentage of the total population, the unemployment rates that Gallup and the U.S. Bureau of Labor Statistics (BLS) report are percentages of the labor force, defined as those who are working or seeking work. While both Gallup and BLS data are based on surveys with large sample sizes, the two have important methodological differences outlined at the end of this article. Additionally, the most-discussed unemployment rate released by the BLS each month is seasonally adjusted, while Gallup reports unadjusted numbers. Although Gallup's unemployment numbers strongly correlate with BLS rates, the BLS and Gallup estimates of unemployment do not always track precisely on a monthly basis.
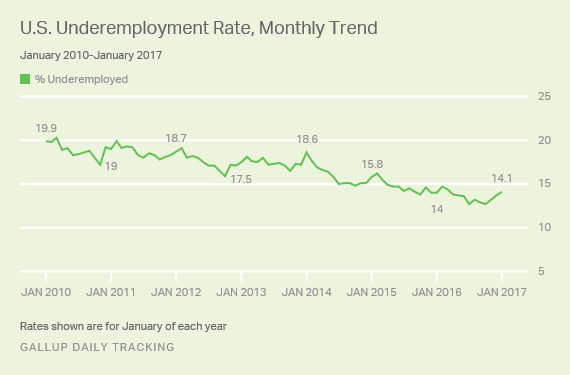
Underemployment Rises to 14.1%
Gallup's measure of underemployment in January was 14.1%, up from 13.7% in December, and 1.4 points higher than the low point measured in October 2016 (12.7%). Gallup's U.S. underemployment rate combines the percentage of adults in the workforce who are unemployed (5.8%) with those who are working part time but desire full-time work (8.3%). The metric has improved considerably since Gallup first measured it in January 2010, when roughly 20% were underemployed.
Underemployment has increased by approximately half a percentage point each month since October 2016. However, while increases in the percentage of adults working part time but wanting full-time work explained much of the increases in November and December, the January increase was driven entirely by the rise in unemployment itself.
Bottom Line
Gallup's 44.8% Good Jobs rate in January 2017 marks another month of record-high full-time employment for an employer, following steady improvement in the GGJ metric since early 2014. In fact, since May 2014, the only month to register a year-over-year decrease was this past December. Because GGJ is usually lowest in the first few months of the year, it is reasonable to expect even higher rates of full-time employment in the coming months.
Gallup's unadjusted unemployment rate has also risen from a low in November, but this fits with previously observed seasonal patterns. If GGJ continues to show strength and workforce participation holds steady, unemployment should continue to register low numbers relative to recent years.
These data are available in Gallup Analytics.
| Most recent month (Jan 2017) | Previous month (Dec 2016) | Month a year ago (Jan 2016) | |||||||||||||||||||||||||||||||||||||||||||||||||||||||||||||||||||||||||||||||||||||||||||||||||
|---|---|---|---|---|---|---|---|---|---|---|---|---|---|---|---|---|---|---|---|---|---|---|---|---|---|---|---|---|---|---|---|---|---|---|---|---|---|---|---|---|---|---|---|---|---|---|---|---|---|---|---|---|---|---|---|---|---|---|---|---|---|---|---|---|---|---|---|---|---|---|---|---|---|---|---|---|---|---|---|---|---|---|---|---|---|---|---|---|---|---|---|---|---|---|---|---|---|---|---|
| % | % | % | |||||||||||||||||||||||||||||||||||||||||||||||||||||||||||||||||||||||||||||||||||||||||||||||||
| Employed full time for employer (GGJ)* | 44.8 | 44.7 | 44.7 | ||||||||||||||||||||||||||||||||||||||||||||||||||||||||||||||||||||||||||||||||||||||||||||||||
| Employed full time for self* | 6.0 | 5.5 | 5.6 | ||||||||||||||||||||||||||||||||||||||||||||||||||||||||||||||||||||||||||||||||||||||||||||||||
| Workforce participation rate* | 67.4 | 66.5 | 66.8 | ||||||||||||||||||||||||||||||||||||||||||||||||||||||||||||||||||||||||||||||||||||||||||||||||
| Unemployment rate ** | 5.8 | 5.2 | 5.5 | ||||||||||||||||||||||||||||||||||||||||||||||||||||||||||||||||||||||||||||||||||||||||||||||||
| Employed part time, wanting full time** | 8.3 | 8.5 | 8.4 | ||||||||||||||||||||||||||||||||||||||||||||||||||||||||||||||||||||||||||||||||||||||||||||||||
| Underemployment rate** | 14.1 | 13.7 | 14.0 | ||||||||||||||||||||||||||||||||||||||||||||||||||||||||||||||||||||||||||||||||||||||||||||||||
| *Metrics represent percentages of the population aged 18+ who have a job or are actively seeking work. **Metrics represent percentages of the workforce. | |||||||||||||||||||||||||||||||||||||||||||||||||||||||||||||||||||||||||||||||||||||||||||||||||||
| Gallup Daily | |||||||||||||||||||||||||||||||||||||||||||||||||||||||||||||||||||||||||||||||||||||||||||||||||||
| GALLUP | U.S. Bureau of Labor Statistics | ||||||||||||||||||||||||||||||||||||||||||||||||||||||||||||||||||||||||||||||||||||||||||||||||||
|---|---|---|---|---|---|---|---|---|---|---|---|---|---|---|---|---|---|---|---|---|---|---|---|---|---|---|---|---|---|---|---|---|---|---|---|---|---|---|---|---|---|---|---|---|---|---|---|---|---|---|---|---|---|---|---|---|---|---|---|---|---|---|---|---|---|---|---|---|---|---|---|---|---|---|---|---|---|---|---|---|---|---|---|---|---|---|---|---|---|---|---|---|---|---|---|---|---|---|---|
| Population | 18 and older | 16 and older | |||||||||||||||||||||||||||||||||||||||||||||||||||||||||||||||||||||||||||||||||||||||||||||||||
| Adjustments | Not seasonally adjusted | Seasonally adjusted | |||||||||||||||||||||||||||||||||||||||||||||||||||||||||||||||||||||||||||||||||||||||||||||||||
| Sample size | 30,000 individuals per month | 60,000 households per month | |||||||||||||||||||||||||||||||||||||||||||||||||||||||||||||||||||||||||||||||||||||||||||||||||
| Mode of interview | RDD telephone, including cellphones | Rotating panel with face-to-face and telephone interviewing | |||||||||||||||||||||||||||||||||||||||||||||||||||||||||||||||||||||||||||||||||||||||||||||||||
| Data collection period | Continuous | One-week reference period during mid-month | |||||||||||||||||||||||||||||||||||||||||||||||||||||||||||||||||||||||||||||||||||||||||||||||||
| Reporting frequency | Daily, weekly and monthly, based on 30-day rolling averages | Monthly, based on one-week reference period | |||||||||||||||||||||||||||||||||||||||||||||||||||||||||||||||||||||||||||||||||||||||||||||||||
| Gallup | |||||||||||||||||||||||||||||||||||||||||||||||||||||||||||||||||||||||||||||||||||||||||||||||||||
Gallup.com reports results from these indexes in daily, weekly, and monthly averages and in Gallup.com stories. Complete trend data are always available to view in the following charts:
Daily: Employment, Economic Confidence, Job Creation, Consumer Spending
Weekly: Employment, Economic Confidence, Job Creation, Consumer Spending
Read more about Gallup's economic measures.
View our economic release schedule.
Survey Methods
Results for this Gallup poll are based on telephone interviews conducted Jan. 2-31, 2017, on the Gallup U.S. Daily survey, with a random sample of 29,456 adults, aged 18 and older, living in all 50 U.S. states and the District of Columbia. For results based on the total sample of national adults, the margin of sampling error is ±1 percentage point at the 95% confidence level. All reported margins of sampling error include computed design effects for weighting.
Each sample of national adults includes a minimum quota of 70% cellphone respondents and 30% landline respondents, with additional minimum quotas by time zone within region. Landline and cellular telephone numbers are selected using random-digit-dial methods.
Learn more about how the Gallup U.S. Daily works.