Story Highlights
- Naples-Immokalee-Marco Island in top 10 since 2012-2013
- Fort Smith, Arkansas-Oklahoma, residents reported the lowest well-being
- Barnstable Town, Massachusetts, edges Boulder, Colorado, in physical well-being
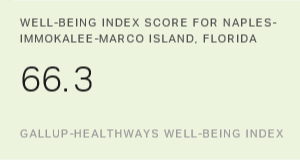
WASHINGTON, D.C. -- Naples-Immokalee-Marco Island, Florida, residents had the highest well-being of the 189 communities Gallup and Healthways surveyed in 2015-2016, claiming the top spot for the second year in a row. Barnstable Town, Massachusetts, and Santa Cruz-Watsonville, California -- each ranked among the top six last year -- had the second- and third-highest well-being, respectively. Urban Honolulu, Hawaii, and Charlottesville, Virginia, rounded out the top five.
| Community | Well-Being Index score | ||||||||||||||||||||||||||||||||||||||||||||||||||||||||||||||||||||||||||||||||||||||||||||||||||
|---|---|---|---|---|---|---|---|---|---|---|---|---|---|---|---|---|---|---|---|---|---|---|---|---|---|---|---|---|---|---|---|---|---|---|---|---|---|---|---|---|---|---|---|---|---|---|---|---|---|---|---|---|---|---|---|---|---|---|---|---|---|---|---|---|---|---|---|---|---|---|---|---|---|---|---|---|---|---|---|---|---|---|---|---|---|---|---|---|---|---|---|---|---|---|---|---|---|---|---|
| Naples-Immokalee-Marco Island, FL | 66.3 | ||||||||||||||||||||||||||||||||||||||||||||||||||||||||||||||||||||||||||||||||||||||||||||||||||
| Barnstable Town, MA | 66.2 | ||||||||||||||||||||||||||||||||||||||||||||||||||||||||||||||||||||||||||||||||||||||||||||||||||
| Santa Cruz-Watsonville, CA | 65.9 | ||||||||||||||||||||||||||||||||||||||||||||||||||||||||||||||||||||||||||||||||||||||||||||||||||
| Urban Honolulu, HI | 65.4 | ||||||||||||||||||||||||||||||||||||||||||||||||||||||||||||||||||||||||||||||||||||||||||||||||||
| Charlottesville, VA | 65.3 | ||||||||||||||||||||||||||||||||||||||||||||||||||||||||||||||||||||||||||||||||||||||||||||||||||
| North Port-Sarasota-Bradenton, FL | 65.2 | ||||||||||||||||||||||||||||||||||||||||||||||||||||||||||||||||||||||||||||||||||||||||||||||||||
| San Luis Obispo-Paso Robles-Arroyo Grande, CA | 65.2 | ||||||||||||||||||||||||||||||||||||||||||||||||||||||||||||||||||||||||||||||||||||||||||||||||||
| Lynchburg, VA | 64.9 | ||||||||||||||||||||||||||||||||||||||||||||||||||||||||||||||||||||||||||||||||||||||||||||||||||
| Hilton Head Island-Bluffton-Beaufort, SC | 64.9 | ||||||||||||||||||||||||||||||||||||||||||||||||||||||||||||||||||||||||||||||||||||||||||||||||||
| Boulder, CO | 64.7 | ||||||||||||||||||||||||||||||||||||||||||||||||||||||||||||||||||||||||||||||||||||||||||||||||||
| Gallup-Healthways Well-Being Index | |||||||||||||||||||||||||||||||||||||||||||||||||||||||||||||||||||||||||||||||||||||||||||||||||||
Naples-Immokalee-Marco Island ascended to the top spot in 2014-2015, having fallen to the No. 7 well-being position in 2012-2013. The area's overall Well-Being Index score was 66.3, 1.3 points higher its 2014-2015 score. This improvement is about triple the improvement measured nationally over this time period. The national Well-Being Index score was 61.6 in 2014, 61.7 in 2015 and 62.1 in 2016.
Gallup tracks Metropolitan Statistical Area (MSA) well-being on the basis of two-year rolling averages, allowing for larger sample sizes that improve the statistical accuracy of the data. About half of all 2015-2016 data in this reporting period overlap with the 2014-2015 index data.
The community-level data are drawn from more than 354,000 interviews with U.S. adults across all 50 states, conducted from Jan. 2, 2015, through Dec. 30, 2016.
All of the top-five communities in 2015-2016 have frequented previous years' lists of the 10 communities with the highest well-being. Other top communities in 2015-2016 that typically have ranked among the highest for well-being since 2008 include North Port-Sarasota-Bradenton, Florida; Boulder, Colorado; and San Luis Obispo-Paso Robles-Arroyo Grande, California.
Lynchburg, Virginia, broke into the top-10 list for the first time in 2015-2016. Hilton Head Island-Bluffton-Beaufort, South Carolina, is also a newcomer, placing ninth in the nation for resident well-being. Hilton Head Island has not previously had a sufficient number of completed interviews to be reported.
In 2015-2016, Fort Smith, Arkansas-Oklahoma, had the lowest overall well-being of the 189 communities measured. Fort Smith was second-lowest to Charleston, West Virginia, in 2014-2015. Charleston did not have enough completed interviews to be reported this year, but it has been among the lowest well-being communities nationally since the onset of the Well-Being Index in 2008.
Along with Fort Smith, most of the communities with the lowest well-being in 2015-2016 have consistently been among the lowest since 2008. These communities include Hickory-Lenoir-Morganton, North Carolina; Huntington-Ashland, West Virginia-Kentucky-Ohio; Chico, California; and Flint, Michigan.
| Community | Well-Being Index score | ||||||||||||||||||||||||||||||||||||||||||||||||||||||||||||||||||||||||||||||||||||||||||||||||||
|---|---|---|---|---|---|---|---|---|---|---|---|---|---|---|---|---|---|---|---|---|---|---|---|---|---|---|---|---|---|---|---|---|---|---|---|---|---|---|---|---|---|---|---|---|---|---|---|---|---|---|---|---|---|---|---|---|---|---|---|---|---|---|---|---|---|---|---|---|---|---|---|---|---|---|---|---|---|---|---|---|---|---|---|---|---|---|---|---|---|---|---|---|---|---|---|---|---|---|---|
| Fort Smith, AR-OK | 57.5 | ||||||||||||||||||||||||||||||||||||||||||||||||||||||||||||||||||||||||||||||||||||||||||||||||||
| Hickory-Lenoir-Morganton, NC | 58.6 | ||||||||||||||||||||||||||||||||||||||||||||||||||||||||||||||||||||||||||||||||||||||||||||||||||
| Huntington-Ashland, WV-KY-OH | 58.7 | ||||||||||||||||||||||||||||||||||||||||||||||||||||||||||||||||||||||||||||||||||||||||||||||||||
| Topeka, KS | 59.3 | ||||||||||||||||||||||||||||||||||||||||||||||||||||||||||||||||||||||||||||||||||||||||||||||||||
| Canton-Massillon, OH | 59.4 | ||||||||||||||||||||||||||||||||||||||||||||||||||||||||||||||||||||||||||||||||||||||||||||||||||
| Flint, MI | 59.4 | ||||||||||||||||||||||||||||||||||||||||||||||||||||||||||||||||||||||||||||||||||||||||||||||||||
| Chico, CA | 59.5 | ||||||||||||||||||||||||||||||||||||||||||||||||||||||||||||||||||||||||||||||||||||||||||||||||||
| Beaumont-Port Arthur, TX | 59.5 | ||||||||||||||||||||||||||||||||||||||||||||||||||||||||||||||||||||||||||||||||||||||||||||||||||
| Erie, PA | 59.7 | ||||||||||||||||||||||||||||||||||||||||||||||||||||||||||||||||||||||||||||||||||||||||||||||||||
| Montgomery, AL | 59.8 | ||||||||||||||||||||||||||||||||||||||||||||||||||||||||||||||||||||||||||||||||||||||||||||||||||
| Gallup-Healthways Well-Being Index | |||||||||||||||||||||||||||||||||||||||||||||||||||||||||||||||||||||||||||||||||||||||||||||||||||
The Gallup-Healthways Well-Being Index is calculated on a scale of 0 to 100, where 0 represents the lowest possible well-being, and 100 represents the highest possible well-being. The Well-Being Index score for the nation and for each community is made up of metrics within each of the five essential elements of well-being:
- Purpose: liking what you do each day and being motivated to achieve your goals
- Social: having supportive relationships and love in your life
- Financial: managing your economic life to reduce stress and increase security
- Community: liking where you live, feeling safe, and having pride in your community
- Physical: having good health and enough energy to get things done daily
In most cases, a difference of 1.0 to 2.0 points in the Well-Being Index score of any two communities represents a statistically significant gap and is characterized by meaningfully large differences in at least some of the individual metrics that make up the Gallup-Healthways Well-Being Index.
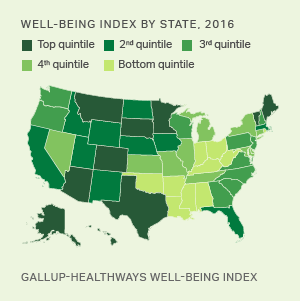
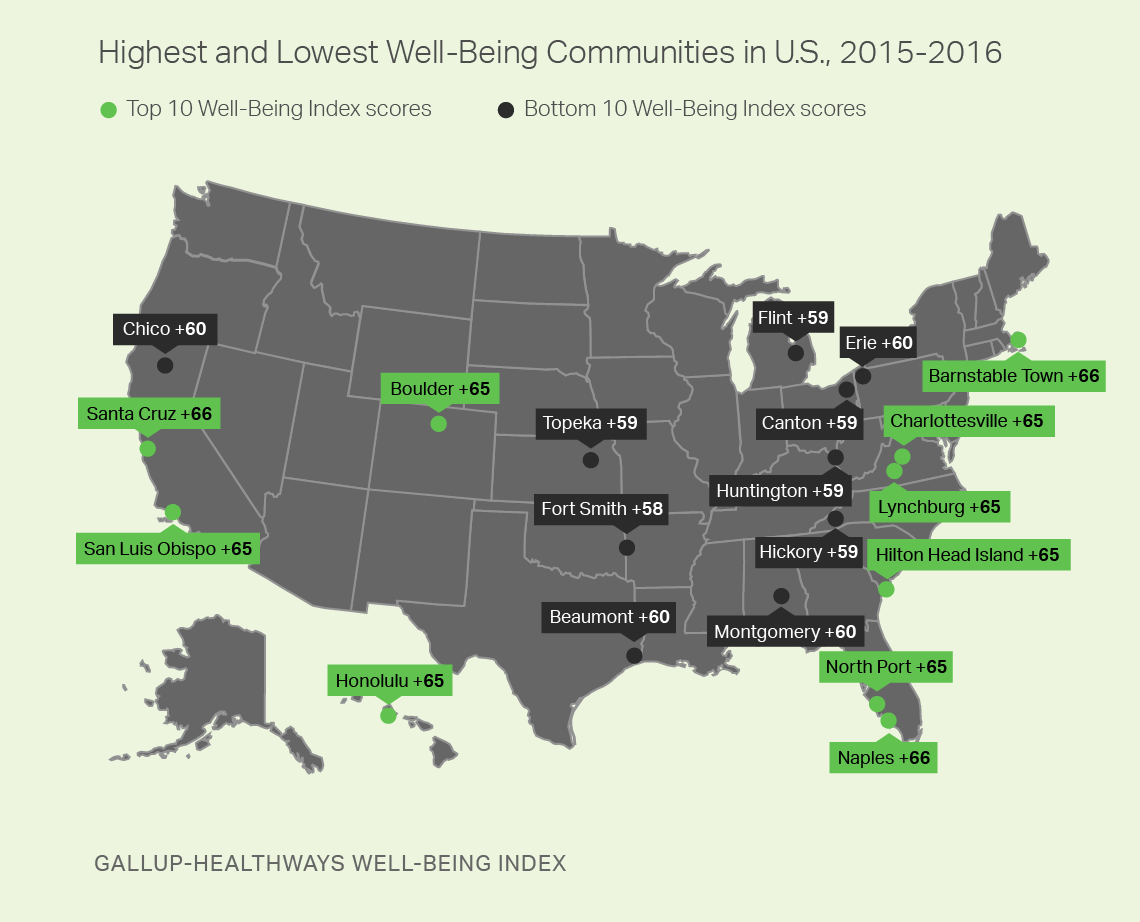
Nationally, the U.S. map of the highest and lowest well-being communities generally approximates what is found among the states, with the lowest well-being found in the South and then winding north through the industrial Midwest. The highest well-being communities are scattered across the eastern seaboard as well as in the West.
The community map more readily reveals the range in well-being among otherwise geographically proximate communities. For example, only about 300 miles separates Charlottesville, Virginia, and Huntington-Ashland, West Virginia -- two communities frequently found each year among the highest and lowest, respectively. One factor that most likely benefits Charlottesville's well-being (relative to Huntington-Ashland's) is the presence of the University of Virginia. Past research has shown that residents of cities with a strong college presence have high well-being.
Naples Among Nation's Best in Four Out of Five Elements
For the second consecutive year, Naples-Immokalee-Marco Island residents had the highest community well-being nationally, again contributing to its top overall well-being ranking. More broadly, Naples-Immokalee-Marco Island is in the top-five list for all well-being elements except financial well-being, which is topped by Florida's other consistently high well-being community: North Port-Sarasota-Bradenton.
Here are highlights for top-ranking communities in other areas of well-being:
-
The state of Texas -- which leads the nation in purpose well-being -- had two communities in the top five for this element in 2015-2016: El Paso and McAllen-Edinburg-Mission.
-
Social well-being is highest among residents of newcomer Hilton Head Island-Bluffton-Beaufort, followed by Barnstable Town. Barnstable Town also edged perennial mainstay Boulder for the highest physical well-being in the U.S.
-
California communities San Luis Obispo-Paso Robles-Arroyo Grande and Santa Cruz-Watsonville were among the top-five communities in and physical well-being.
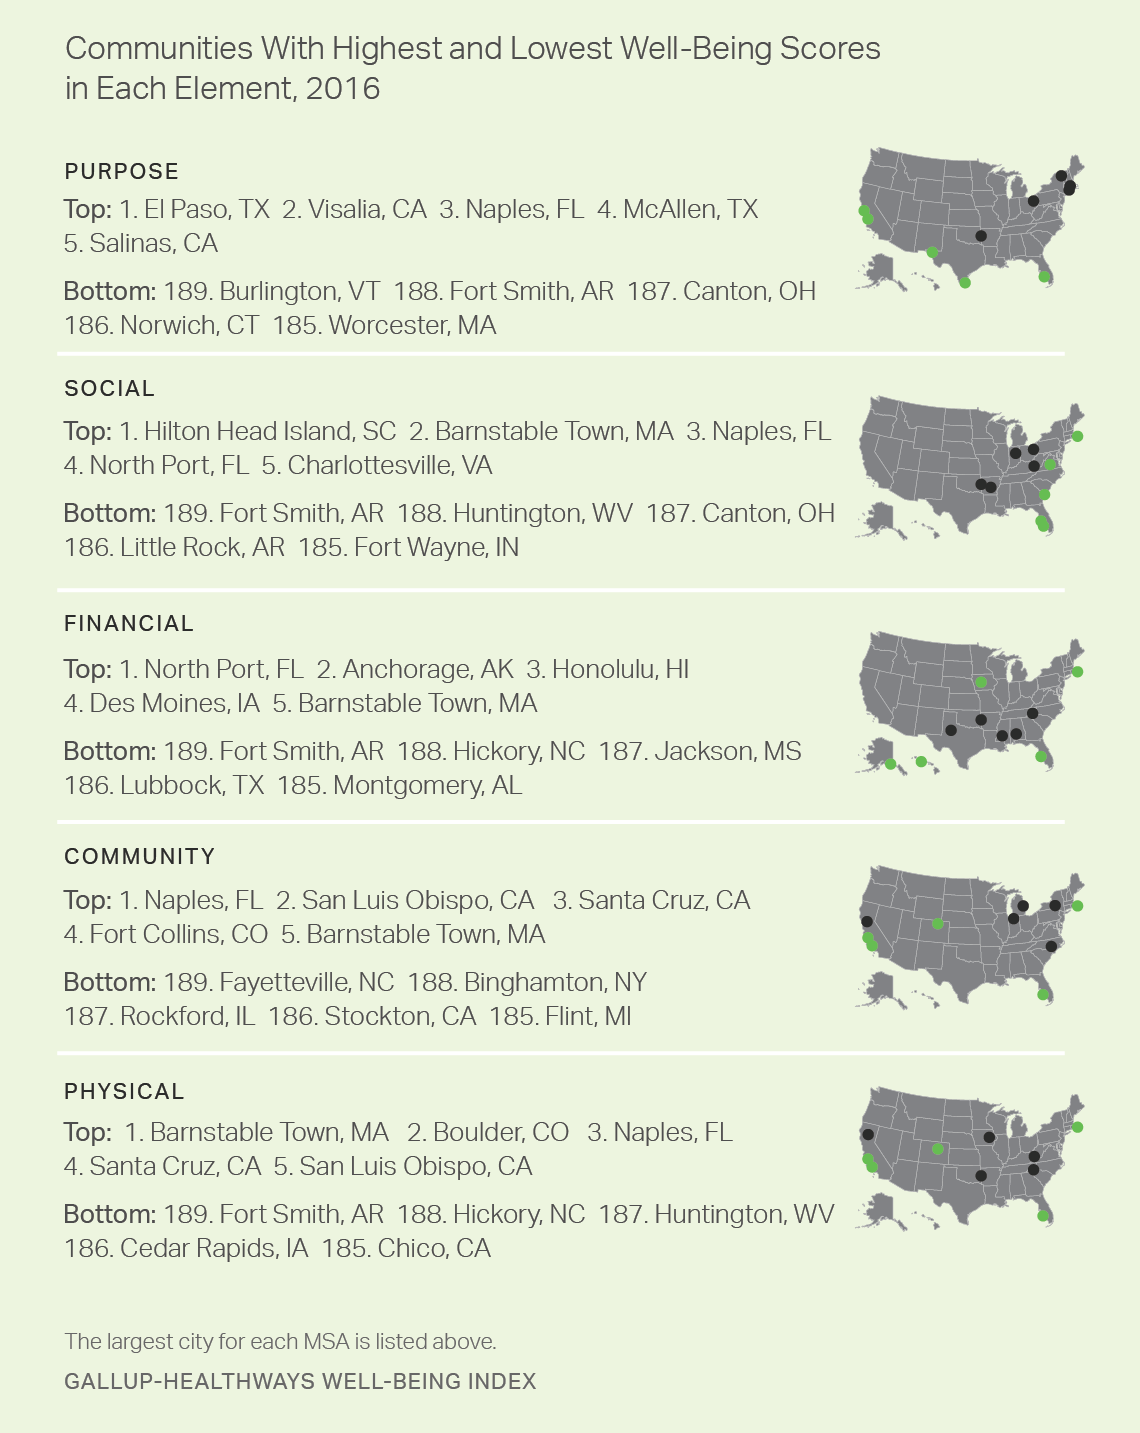
Residents of Fort Smith had the lowest or second-lowest well-being in four of the five elements: purpose, social, financial and physical. Similarly, Huntington-Ashland; Hickory-Lenoir-Morgantown, North Carolina; and Canton-Massillon, Ohio, were among the bottom three nationally in two elements each. Flint, Michigan -- which has suffered from a water purity crisis since 2014 and continues to advise residents to use filtered water -- was in the bottom five for community well-being for the second year in a row.
Implications
While there is a significant range in state-level well-being scores, the range in community well-being scores is even greater, and sometimes community differences are even substantial within the same state. These differences can provide opportunities for low well-being communities to view examples of best practices in similar cities -- both geographically and culturally -- nationwide.
Culture, in particular, is a key component of well-being that is likely easier to influence within a community than throughout a state, as the norms that affect residents' behaviors can manifest themselves in a more localized environment. Leaders, in turn, have a better opportunity to affect culture with local, more narrowly defined citizenries than among those that are broader and more diverse. The structural advantage provided by a smaller, local environment arguably means leaders have a greater responsibility to engender the well-being of the residents they are empowered to lead.
Mechanisms exist that can assist with improving community well-being. One is the Blue Zones Project, which is currently active in nine states nationally -- including in and around Naples. Naples has not only consistently maintained its well-being advantage relative to the rest of the nation, but its well-being has also been shown to be improving faster than what is found nationally. This is the earmark of an area that has strong well-being and that is striving to get better, reflecting good leadership and elevating the type of culture that can potentially fortify its gains well into the future. For those communities seeking real, long-term improvement, Naples can serve as a tangible example to model for both practical and inspirational reasons.
For more data and insights on well-being in U.S. communities, read the State of American Well-Being: 2016 Community Rankings report.
Survey Methods
Results are based a subset of 354,473 telephone interviews with U.S. adults across all 50 states and the District of Columbia, conducted from Jan. 2, 2015, to Dec. 30, 2016. In 2015, 177,281 interviews were conducted nationally; in 2016, 177,192 interviews were conducted. Gallup conducts 500 telephone interviews daily, resulting in a sample that projects to an estimated 95 percent of all U.S. adults. Metropolitan Statistical Areas (MSAs) are based on U.S. Office of Management and Budget definitions. Only MSAs with at least 300 completed interviews are reported, and results for each MSA are uniquely weighted according to Nielsen Claritas demographic targets.
The Well-Being Index margin of sampling error for the reported communities will range from about ±1.7 points for the least populated to about ±0.3 points for the most heavily populated. All reported margins of sampling error include computed design effects due to weighting.
Each daily sample of national adults for data collected between Jan. 2-Sept. 1, 2015, was comprised of 50% cellphone respondents and 50% landline respondents. Each daily sample beginning Sept. 1, 2015, through Dec. 30, 2016, is made up of 60% cellphone respondents and 40% landline respondents. Additional minimum quotas by time zone and within region are included in the sampling approach.
Learn more about how the Gallup-Healthways Well-Being Index works.