Story Highlights
- Americans' daily spending average increases to $101 in February
- Boost in February spending higher than in previous years
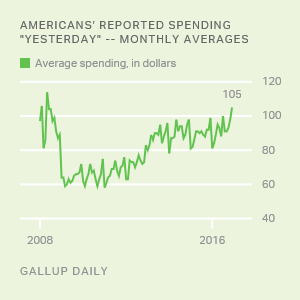
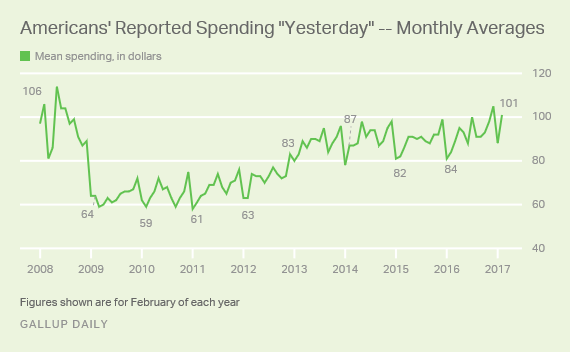
WASHINGTON, D.C. -- Americans' daily self-reports of spending climbed to an average of $101 in February. This is the highest average for the month of February since 2008, when spending averaged $106. The latest monthly average is up $13 from January's figure, but still lower than December's holiday-influenced $105.
This is the seventh daily spending average of $100 or more that Gallup has recorded for any month over nine years of tracking Americans' spending reports, and the only one in February since 2008. During that year -- but before the global financial crisis in the fall -- Americans' monthly average spending exceeded $100 four times.
It took eight years for Americans' spending to return to this pre-crisis level, as consumers' "new normal" aversion to spending took hold after the recession and ensuing periods of high unemployment. Their hesitancy began to ease in recent years, and average daily spending once again reached the $100 mark in July 2016. Spending rose to a nine-year high in December and returned to a triple-digit average again in February after a predictable seasonal drop in January.
While monthly spending figures vary, Gallup's annual averages show that Americans' average daily spending from 2013 to 2016 has been considerably higher than the lows from 2009 to 2012, but has still not returned to its 2008 high of $96.
The February average is based on more than 14,000 interviews conducted as part of Gallup Daily tracking throughout the month. Gallup asks Americans each night to report how much they spent the previous day, excluding spending on normal household bills and major purchases such as a home or car. The measure gives an indication of discretionary spending.
Boost in February Spending Higher Than in Previous Years
Since 2008, Americans' spending in the month of February has generally been similar to their January spending, though it is common to see a slight increase in February after January's seasonal, post-holiday drop.
But the January-to-February increase in 2017 is larger than usual, with this year's $13 bump outpacing the previous record $9 increases in 2008 and 2014.
| January | February | Change | |||||||||||||||||||||||||||||||||||||||||||||||||||||||||||||||||||||||||||||||||||||||||||||||||
|---|---|---|---|---|---|---|---|---|---|---|---|---|---|---|---|---|---|---|---|---|---|---|---|---|---|---|---|---|---|---|---|---|---|---|---|---|---|---|---|---|---|---|---|---|---|---|---|---|---|---|---|---|---|---|---|---|---|---|---|---|---|---|---|---|---|---|---|---|---|---|---|---|---|---|---|---|---|---|---|---|---|---|---|---|---|---|---|---|---|---|---|---|---|---|---|---|---|---|---|
| $ | $ | $ | |||||||||||||||||||||||||||||||||||||||||||||||||||||||||||||||||||||||||||||||||||||||||||||||||
| 2017 | 88 | 101 | +13 | ||||||||||||||||||||||||||||||||||||||||||||||||||||||||||||||||||||||||||||||||||||||||||||||||
| 2016 | 81 | 84 | +3 | ||||||||||||||||||||||||||||||||||||||||||||||||||||||||||||||||||||||||||||||||||||||||||||||||
| 2015 | 81 | 82 | +1 | ||||||||||||||||||||||||||||||||||||||||||||||||||||||||||||||||||||||||||||||||||||||||||||||||
| 2014 | 78 | 87 | +9 | ||||||||||||||||||||||||||||||||||||||||||||||||||||||||||||||||||||||||||||||||||||||||||||||||
| 2013 | 80 | 83 | +3 | ||||||||||||||||||||||||||||||||||||||||||||||||||||||||||||||||||||||||||||||||||||||||||||||||
| 2012 | 63 | 63 | 0 | ||||||||||||||||||||||||||||||||||||||||||||||||||||||||||||||||||||||||||||||||||||||||||||||||
| 2011 | 58 | 61 | +3 | ||||||||||||||||||||||||||||||||||||||||||||||||||||||||||||||||||||||||||||||||||||||||||||||||
| 2010 | 62 | 59 | -3 | ||||||||||||||||||||||||||||||||||||||||||||||||||||||||||||||||||||||||||||||||||||||||||||||||
| 2009 | 64 | $64 | 0 | ||||||||||||||||||||||||||||||||||||||||||||||||||||||||||||||||||||||||||||||||||||||||||||||||
| 2008 | 97 | 106 | +9 | ||||||||||||||||||||||||||||||||||||||||||||||||||||||||||||||||||||||||||||||||||||||||||||||||
| Gallup Daily | |||||||||||||||||||||||||||||||||||||||||||||||||||||||||||||||||||||||||||||||||||||||||||||||||||
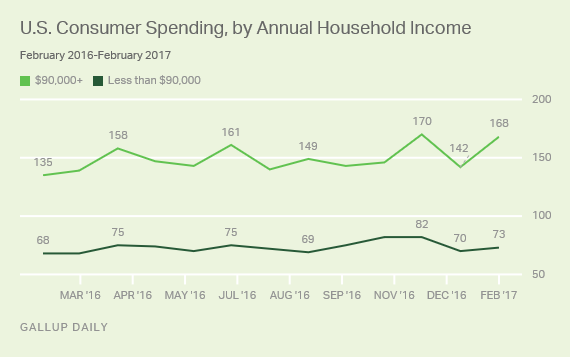
Spending Up Significantly Among Higher Earners
The increase in spending was slight -- to $73 from $70 in January -- among Americans living in households that earn less than $90,000 annually.
The increase among higher earners was much larger. Consumers in households earning $90,000 or more annually spent significantly more in February than in January -- $168 versus $142. This $26 month-to-month increase is one of the largest Gallup has found for this group in its nine years of tracking.
Bottom Line
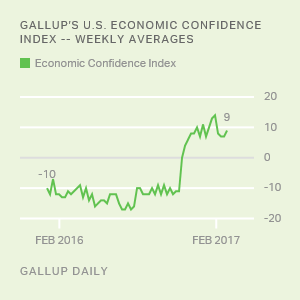
Americans' views of the U.S. economy have improved markedly since Donald Trump's election in November; and with stock market averages reaching new highs this year, they may be in a position to feel more comfortable than they have been in loosening their purse strings.
While Americans' spending in recent years has accelerated, 2017 monthly averages would need to regularly surpass $100 to return to or exceed spending levels before the global economic crisis. Average February spending since 2008 has generally not been high, so last month's strong figure could put spending on solid footing going into March, whose figure has equaled or surpassed February's average each year since 2010.
These data are available in Gallup Analytics.
Gallup.com reports results from these indexes in daily, weekly and monthly averages and in Gallup.com stories. Complete trend data are always available to view in the following charts:
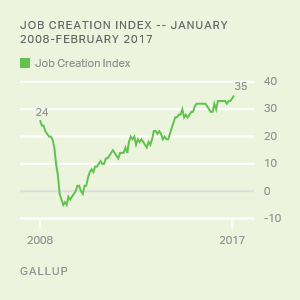
Daily: Employment, Economic Confidence, Consumer Spending
Weekly: Employment, Economic Confidence, Job Creation, Consumer Spending
Read more about Gallup's economic measures.
View our economic release schedule.
Survey Methods
Results for this Gallup poll are based on telephone interviews conducted Feb. 1-28, 2017, on the Gallup U.S. Daily survey, with a random sample of 14,193 adults, aged 18 and older, living in all 50 U.S. states and the District of Columbia. For results based on the total sample of national adults, the margin of error for the spending mean is ±$5 at the 95% confidence level. All reported margins of sampling error include computed design effects for weighting.
Each sample of national adults includes a minimum quota of 70% cellphone respondents and 30% landline respondents, with additional minimum quotas by time zone within region. Landline and cellular telephone numbers are selected using random-digit-dial methods.
Learn more about how the Gallup U.S. Daily works.