Story Highlights
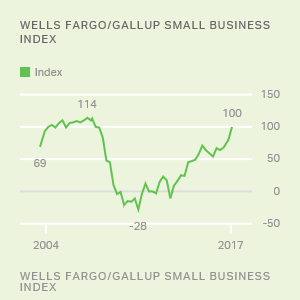
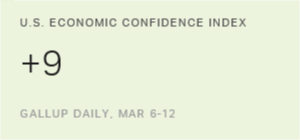
- Index at +9, down from prior week's record high of +16
- Current index reading matches post-election average
- Sharp fluctuation tied to changes in Americans' economic outlook
WASHINGTON, D.C. -- Americans' confidence in the economy returned to its recent levels last week after a record-setting post-recession high the week before. Gallup's U.S. Economic Confidence Index was +9 for the week ending March 12. This is down from +16 the previous week. The latest figure is in line with weekly scores recorded throughout February.
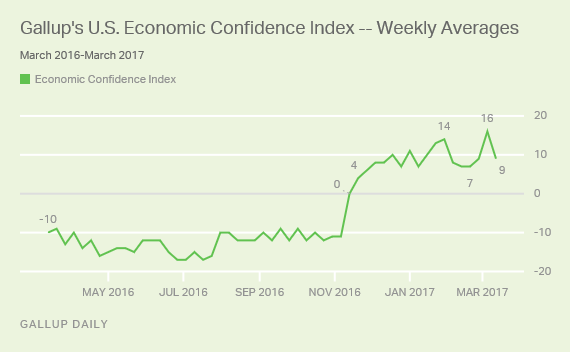
The current +9 reading also matches the average for weekly confidence scores since the presidential election in November. Since late November, Americans have expressed higher confidence in the U.S. economy than they have during any period since Gallup began tracking the index in 2008.
Gallup's U.S. Economic Confidence Index is the average of two components: how Americans rate current economic conditions and whether they feel the economy is improving or getting worse. The index has a theoretical maximum of +100 if all Americans were to say the economy is doing well and improving, and a theoretical minimum of -100 if all Americans were to say the economy is doing poorly and getting worse.
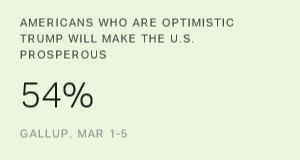
The fluctuation in the index's scores in March reflects a correction in Americans' outlook for the direction of the economy, which was particularly sunny despite political party affiliation in the week President Donald Trump gave a generally well-received address to Congress and the stock market rallied to new heights.
While economic confidence among Republicans has remained steadily high for the past three weeks, the fluctuation in the latest national figure resulted from movement among Democrats and independents, whose confidence returned this past week to previous lower levels.
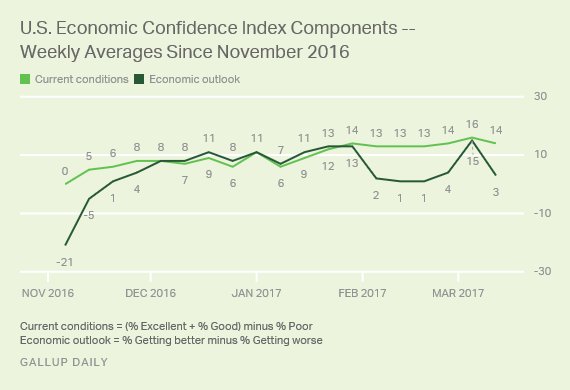
Currently, 48% of Americans say the economy is getting better, and 45% say it is getting worse. That compares with 54% and 39%, respectively, the prior week. As a result, the economic outlook component of Gallup's index fell to +3 from +15.
Meanwhile, Americans' assessments of current economic conditions were largely unchanged. For the week ending March 12, 34% of Americans rated the economy as "excellent" or "good," and 20% rated it as "poor," resulting in a +14 current conditions score -- about where it has been since late January.
Bottom Line
Americans' current level of economic confidence is about where it was before the stock market rally and Trump's address to Congress -- and it is well above the mostly negative scores Gallup recorded from 2008 to late 2016. Their confidence may have subsided last week after a slight decline in the Dow Jones industrial average after its massive gains in February.
These data are available in Gallup Analytics.
Gallup.com reports results from these indexes in daily, weekly and monthly averages and in Gallup.com stories. Complete trend data are always available to view in the following charts:
Daily: Employment, Economic Confidence, Consumer Spending
Weekly: Employment, Economic Confidence, Job Creation, Consumer Spending
Read more about Gallup's economic measures.
View our economic release schedule.
Survey Methods
Results for this Gallup poll are based on telephone interviews conducted March 6-12, 2017, on the Gallup U.S. Daily survey, with a random sample of 3,541 adults, aged 18 and older, living in all 50 U.S. states and the District of Columbia. For results based on the total sample of national adults, the margin of sampling error is ±2 percentage points at the 95% confidence level. All reported margins of sampling error include computed design effects for weighting.
Each sample of national adults includes a minimum quota of 70% cellphone respondents and 30% landline respondents, with additional minimum quotas by time zone within region. Landline and cellular telephone numbers are selected using random-digit-dial methods.
Learn more about how the Gallup U.S. Daily works.