Story Highlights
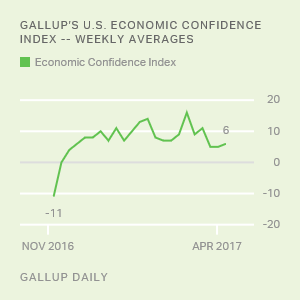
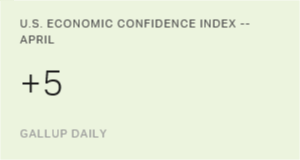
- Economic Confidence Index at +5 in April versus +9 in March
- Index positive for sixth straight month
WASHINGTON, D.C. -- Americans' economic confidence weakened slightly in April, but they remain positive about the current state of the U.S. economy. Gallup's U.S. Economic Confidence Index averaged +5 in April, down four points from March's average. Despite the dip, confidence has been in positive territory for six consecutive months -- the longest such streak in the past nine years.

Gallup's U.S. Economic Confidence Index is the average of two components: how Americans rate current economic conditions and whether they feel the economy is improving or getting worse. The index has a theoretical maximum of +100 if all Americans were to say the economy is doing well and improving, and a theoretical minimum of -100 if all were to say the economy is doing poorly and getting worse.
In April, 32% of Americans rated economic conditions in the country as "excellent" or "good," while 21% rated conditions as "poor." This left the current conditions component of the index at +11 for the month, down slightly from March's +13.
Meanwhile, 46% of Americans said the economy was "getting better" in April, while 47% said it was "getting worse." Because of this, the economic outlook component fell to -1 from +4 in March.
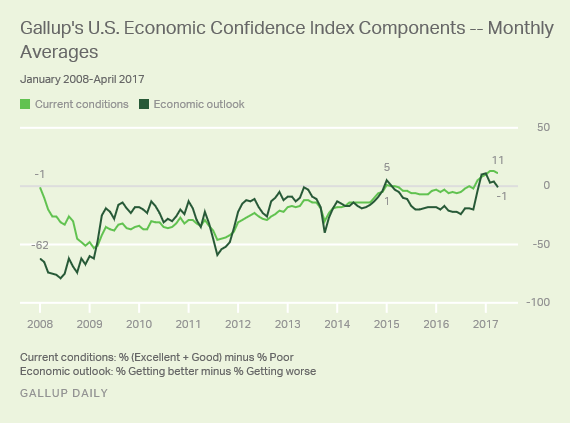
Perceptions Not Yet Fully Matching Economic Reality
Gallup began tracking Americans' confidence in the economy in January 2008. For nearly this entire period, which included a deep recession and a slow recovery, Americans have been more pessimistic than optimistic about the state of the economy.
The first two months of 2015 seemed to mark a new era of economic confidence, with net-positive economic evaluations recorded for the first time since at least before 2008. Gallup attributed this rising confidence to a fall in U.S. gas prices in late 2014. But as prices edged back up in early 2015, confidence returned to negative territory, where it remained until November 2016.
This latest round of economic optimism appears to have been sparked primarily by President Donald Trump's election. Confidence among Republicans and, to a lesser extent, independents rose sharply after Election Day.
Beyond this partisan effect, Gallup found that many Americans believe Trump will be most effective at implementing an agenda that helps grow the economy, and this is likely bolstering overall economic confidence -- along with other related measures. In April, for instance, Gallup found that Americans' assessments of their current financial situations were the most positive they have been in a decade.
Further, Americans' confidence in the economy has risen along with their outlook for specific economic segments, including the business community and the manufacturing sector, according to various survey data. Additionally, the stock market -- seen by some analysts as a good gauge of the overall health of the economy -- has hit new records during this period.
Nonetheless, improved economic confidence has yet to translate into notable gains in "hard" measures of actual economic output, such as gross domestic product or consumer spending. "Soft" data -- measuring general economic perceptions such as Gallup's U.S. Economic Confidence Index -- and "hard" data are telling two different stories of the U.S. economy. The soft data seem to suggest strong economic growth is just around the corner, while the hard data -- as evidenced by Friday's GDP report -- currently depict an economy that is slowly growing. Right now, it isn't clear which version is more accurate.
These data are available in Gallup Analytics.
Gallup.com reports results from these indexes in daily, weekly and monthly averages and in Gallup.com stories. Complete trend data are always available to view in the following charts:
Daily: Employment, Economic Confidence, Consumer Spending
Weekly: Employment, Economic Confidence, Job Creation, Consumer Spending
Read more about Gallup's economic measures.
View our economic release schedule.
Survey Methods
Results for this Gallup poll are based on telephone interviews conducted April 1-30, 2017, on the Gallup U.S. Daily survey, with a random sample of 14,682 adults, aged 18 and older, living in all 50 U.S. states and the District of Columbia. For results based on the total sample of national adults, the margin of sampling error is ±1 percentage point at the 95% confidence level. All reported margins of sampling error include computed design effects for weighting.
Each sample of national adults includes a minimum quota of 70% cellphone respondents and 30% landline respondents, with additional minimum quotas by time zone within region. Landline and cellular telephone numbers are selected using random-digit-dial methods.
Learn more about how the Gallup U.S. Daily works.