Story Highlights
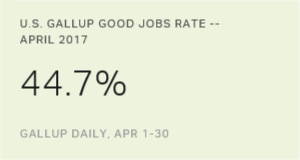
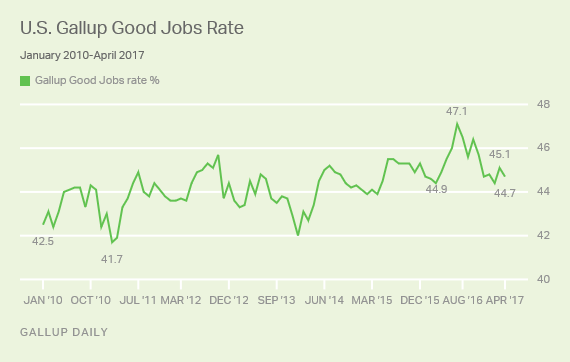
- GGJ rate declined to 44.7% in April, down from 45.1% in March
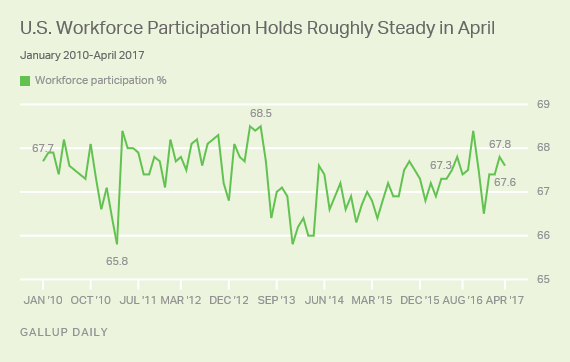
- Workforce participation essentially holds steady at 67.6%
- Unemployment was basically unchanged at 5.5%
WASHINGTON, D.C. -- The U.S. Gallup Good Jobs Rate fell to 44.7% in April, down from 45.1% in March, but higher than the 44.4% measured in February. The current GGJ rate is slightly lower than the 44.9% recorded in April 2016.
These latest data come from Gallup Daily tracking interviews with nearly 30,000 U.S. adults conducted April 1-30.
Prior to this year, the GGJ had increased five times out of seven from March to April since tracking began, and was essentially unchanged the other two occasions. The current decline of 0.4 points is effectively the only meaningful drop from March to April since the GGJ tracking began in January 2010.
The GGJ is the percentage of U.S. adults, age 18 or older, who were employed on a full-time basis -- at least 30 hours a week -- by an employer. Therefore, individuals who are self-employed, work fewer than 30 hours a week, are unemployed or are out of the workforce are not counted as being full-time employed. The GGJ metric only measures whether someone is employed full time by an employer and does not include measures of job satisfaction or compensation. GGJ is not seasonally adjusted.
While the GGJ has fluctuated on a monthly basis since Gallup first began tracking the measure in January 2010, it has generally trended up. The low point for the GGJ was 41.7% in February 2011, as the economy struggled to recover from the Great Recession and the high unemployment rate that followed. The highest point was 47.1% in July 2016.
Workforce Participation Essentially Unchanged
The U.S. workforce participation rate essentially held steady at 67.6% in April, little changed from 67.8% in March. The rate is roughly the same as a year ago, when workforce participation was 67.3%.
Gallup's workforce participation rate measures the percentage of U.S. adults 18 years of age or older who work on a full- or part-time basis or who are not working, but actively seeking employment.
Unemployment Holds Steady in April
The unemployment rate for April was 5.5%, essentially unchanged from the 5.6% recorded in February and March. This is well below the peak unemployment rate of 10.9% found in January 2010 and roughly the same as the 5.2% measured a year ago.
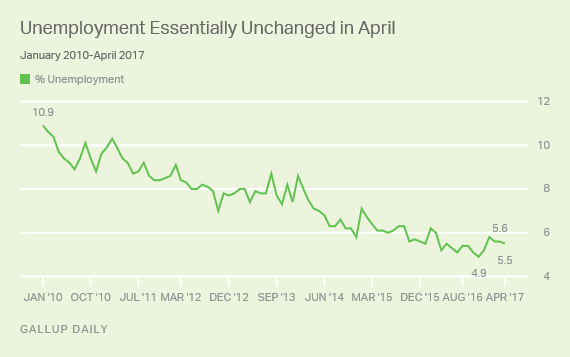
Whereas the GGJ rate is based on the total U.S. adult population, both the Gallup and U.S. Bureau of Labor Statistics (BLS) unemployment rates are percentages of the labor force, defined as those who are working or seeking work. While the Gallup and BLS measures are similar, there are methodological differences between the two. These differences are outlined at the end of this article.
Perhaps the most significant difference is that the BLS seasonally adjusts its most commonly used measure of unemployment, while Gallup does not. Gallup's measure has a strong correlation to those released by the BLS. However, the two measures do not always match on a monthly basis.
Underemployment Up in April
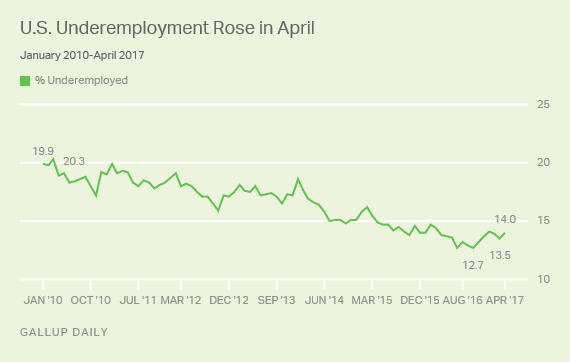
The percentage of the population who is underemployed rose to 14.0% in April, up from 13.5% last month. The current underemployment rate is roughly equal to that of January (14.1%) and February (13.9%), as well as a year ago (13.8%). Underemployment is still far better than its high point of 20.3% recorded in March 2010.
Gallup's measure of underemployment is a combination of U.S. adults in the workforce who are unemployed (5.5%) and those who are working part-time jobs, but desire full-time work (8.5%).
Bottom Line
Gallup's employment measures for April present a generally stable view of the state of the economy. The Gallup Good Jobs rate measure edged slightly lower, while underemployment shifted slightly higher. Workforce participation and unemployment did not shift in a meaningful way.
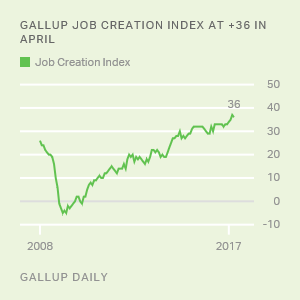
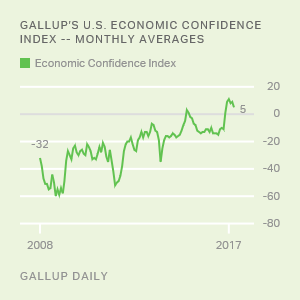
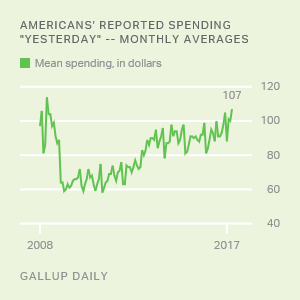
Other Gallup economic measures for April also follow this pattern. U.S. economic confidence fell for the month, but remained positive. At $107, Americans' reports of their daily spending are at the highest point since May 2008, though the level is not meaningfully different than the high of $105 hit in December 2016. The Gallup Job Creation Index was down slightly in April, but still near its record high.
These data are available in Gallup Analytics.
Gallup.com reports results from these indexes in daily, weekly, and monthly averages and in Gallup.com stories. Complete trend data are always available to view in the following charts:
Daily: Employment, Economic Confidence, Job Creation, Consumer Spending
Weekly: Employment, Economic Confidence, Job Creation, Consumer Spending
Read more about Gallup's economic measures.
View our economic release schedule.
| Most recent month (Apr 2017) | Previous month (Mar 2017) | Month a year ago (Apr 2016) | |||||||||||||||||||||||||||||||||||||||||||||||||||||||||||||||||||||||||||||||||||||||||||||||||
|---|---|---|---|---|---|---|---|---|---|---|---|---|---|---|---|---|---|---|---|---|---|---|---|---|---|---|---|---|---|---|---|---|---|---|---|---|---|---|---|---|---|---|---|---|---|---|---|---|---|---|---|---|---|---|---|---|---|---|---|---|---|---|---|---|---|---|---|---|---|---|---|---|---|---|---|---|---|---|---|---|---|---|---|---|---|---|---|---|---|---|---|---|---|---|---|---|---|---|---|
| % | % | % | |||||||||||||||||||||||||||||||||||||||||||||||||||||||||||||||||||||||||||||||||||||||||||||||||
| Employed full time for an employer (GGJ)* | 44.7 | 45.1 | 44.9 | ||||||||||||||||||||||||||||||||||||||||||||||||||||||||||||||||||||||||||||||||||||||||||||||||
| Employed full time for self* | 9.1 | 8.9 | 8.8 | ||||||||||||||||||||||||||||||||||||||||||||||||||||||||||||||||||||||||||||||||||||||||||||||||
| Workforce participation rate* | 67.6 | 67.8 | 67.3 | ||||||||||||||||||||||||||||||||||||||||||||||||||||||||||||||||||||||||||||||||||||||||||||||||
| Unemployment rate** | 5.5 | 5.6 | 5.2 | ||||||||||||||||||||||||||||||||||||||||||||||||||||||||||||||||||||||||||||||||||||||||||||||||
| Employed part time, wanting full time** | 5.8 | 5.4 | 5.8 | ||||||||||||||||||||||||||||||||||||||||||||||||||||||||||||||||||||||||||||||||||||||||||||||||
| Underemployment rate** | 14.0 | 13.5 | 13.8 | ||||||||||||||||||||||||||||||||||||||||||||||||||||||||||||||||||||||||||||||||||||||||||||||||
| *Metrics represent percentages of the population aged 18+ who have a job or are actively seeking work. **Metrics represent percentages of the workforce. | |||||||||||||||||||||||||||||||||||||||||||||||||||||||||||||||||||||||||||||||||||||||||||||||||||
| Gallup Daily | |||||||||||||||||||||||||||||||||||||||||||||||||||||||||||||||||||||||||||||||||||||||||||||||||||
| Gallup | U.S. Bureau of Labor Statistics | ||||||||||||||||||||||||||||||||||||||||||||||||||||||||||||||||||||||||||||||||||||||||||||||||||
|---|---|---|---|---|---|---|---|---|---|---|---|---|---|---|---|---|---|---|---|---|---|---|---|---|---|---|---|---|---|---|---|---|---|---|---|---|---|---|---|---|---|---|---|---|---|---|---|---|---|---|---|---|---|---|---|---|---|---|---|---|---|---|---|---|---|---|---|---|---|---|---|---|---|---|---|---|---|---|---|---|---|---|---|---|---|---|---|---|---|---|---|---|---|---|---|---|---|---|---|
| Population | 18 and older | 16 and older | |||||||||||||||||||||||||||||||||||||||||||||||||||||||||||||||||||||||||||||||||||||||||||||||||
| Adjustments | Not seasonally adjusted | Seasonally adjusted | |||||||||||||||||||||||||||||||||||||||||||||||||||||||||||||||||||||||||||||||||||||||||||||||||
| Sample size | 30,000 individuals per month | 60,000 households per month | |||||||||||||||||||||||||||||||||||||||||||||||||||||||||||||||||||||||||||||||||||||||||||||||||
| Mode of interview | RDD telephone, including cellphones | Rotating panel with face-to-face and telephone interviewing | |||||||||||||||||||||||||||||||||||||||||||||||||||||||||||||||||||||||||||||||||||||||||||||||||
| Data collection period | Continuous | One-week reference period occurring mid-month | |||||||||||||||||||||||||||||||||||||||||||||||||||||||||||||||||||||||||||||||||||||||||||||||||
| Reporting frequency | Daily, weekly, monthly, based on 30-day rolling averages | Monthly, based on one-week reference period | |||||||||||||||||||||||||||||||||||||||||||||||||||||||||||||||||||||||||||||||||||||||||||||||||
| Gallup | |||||||||||||||||||||||||||||||||||||||||||||||||||||||||||||||||||||||||||||||||||||||||||||||||||
Survey Methods
Results for this Gallup poll are based on telephone interviews conducted April 1-30, 2017, on the Gallup U.S. Daily survey, with a random sample of 29,395 adults, aged 18 and older, living in all 50 U.S. states and the District of Columbia. For results based on the total sample of national adults, the margin of sampling error is ±1 percentage point at the 95% confidence level. All reported margins of sampling error include computed design effects for weighting.
Each sample of national adults includes a minimum quota of 70% cellphone respondents and 30% landline respondents, with additional minimum quotas by time zone within region. Landline and cellular telephone numbers are selected using random-digit-dial methods.
Learn more about how the Gallup U.S. Daily works.