Story Highlights
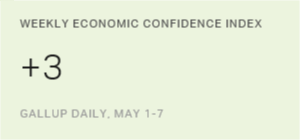
- Index stands at +3, down four points in two weeks
- Assessments of present conditions largely stable, but outlook has declined
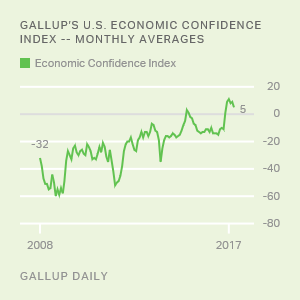
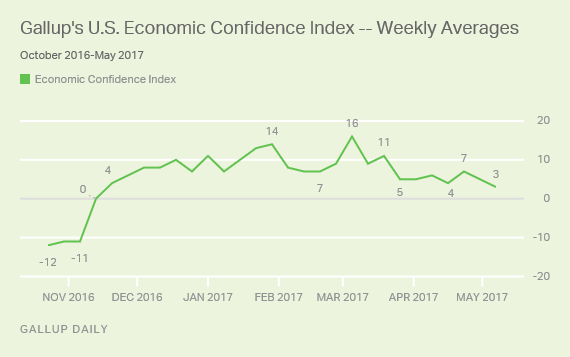
WASHINGTON, D.C. -- Americans' views of the economy remain positive on balance, but just barely. Gallup's U.S. Economic Confidence Index averaged +3 for the week ending May 7. The index is down four points from two weeks ago and now sits at a nominal low for the year after trending downward from its early March peak.
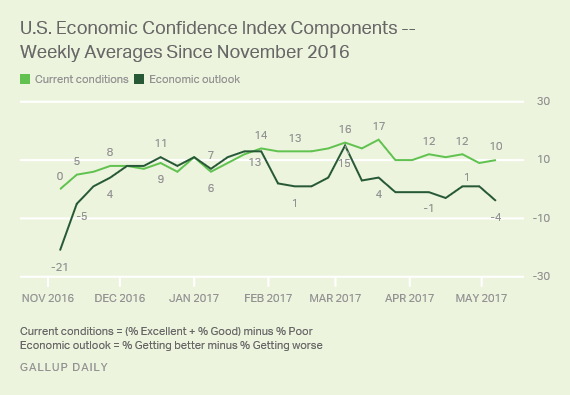
Gallup's U.S. Economic Confidence Index is the average of two components: how Americans rate current economic conditions and whether they feel the economy is improving or getting worse. The index has a theoretical maximum of +100 if all Americans were to say the economy is doing well and improving, and a theoretical minimum of -100 if all were to say the economy is doing poorly and getting worse.
From a broader perspective, Americans remain relatively chipper about the state of the U.S. economy since the November election. In absolute terms, Gallup's Economic Confidence Index has posted a positive value 25 weeks in a row, indicating more Americans are optimistic about the economy than pessimistic. The index is still 14 points above where it stood right before the 2016 election.
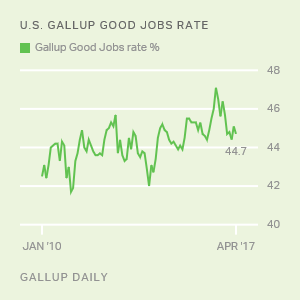
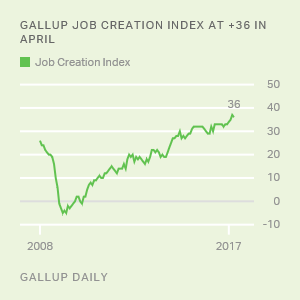
But while the metric remains in positive territory, it now sits at its lowest level in six months. This occurs even as Americans' feelings about the current state of the economy have been stable and positive -- perceptions that mesh well with Friday's jobs report, which saw the U.S. unemployment rate fall to 4.4%, its lowest reading since May 2007. The same report showed the government's U-6 rate, or what Gallup calls the "real unemployment" rate, lower than that metric has been since November 2007.
But for many Americans, it's not the current state of the economy clouding their overall rating of the economy, but their perceptions of economic times ahead.
With slightly less than a third of Americans (32%) calling current economic conditions "excellent" or "good," and 22% calling them "poor," the current conditions component of the index stood at +10 last week. This represents essentially no change from the previous week, when the component averaged +9. And although the current reading is seven points below the component's nine-year high of +17 recorded in mid-March, it is on par with the average weekly score in the post-election period (+11).
By contrast, fewer Americans last week said the economy was "getting better" (45%) than said it was "getting worse" (49%), leaving the economic outlook component at -4, its worst score since Nov. 7-13, when it measured -5. It is now nearly 20 points below its recent high of +15 set in early March and nine points lower than its average score in the post-election period.
These data are available in Gallup Analytics.
Gallup.com reports results from these indexes in daily, weekly and monthly averages and in Gallup.com stories. Complete trend data are always available to view in the following charts:
Daily: Employment, Economic Confidence, Consumer Spending
Weekly: Employment, Economic Confidence, Job Creation, Consumer Spending
Read more about Gallup's economic measures.
View our economic release schedule.
Survey Methods
Results for this Gallup poll are based on telephone interviews conducted May 1-7, 2017, on the Gallup U.S. Daily survey, with a random sample of 3,046 adults, aged 18 and older, living in all 50 U.S. states and the District of Columbia. For results based on the total sample of national adults, the margin of sampling error is ±2 percentage points at the 95% confidence level. All reported margins of sampling error include computed design effects for weighting.
Each sample of national adults includes a minimum quota of 70% cellphone respondents and 30% landline respondents, with additional minimum quotas by time zone within region. Landline and cellular telephone numbers are selected using random-digit-dial methods.
Learn more about how the Gallup U.S. Daily works.