Story Highlights
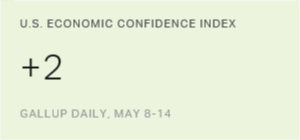
- Index stands at +2, a new low for 2017
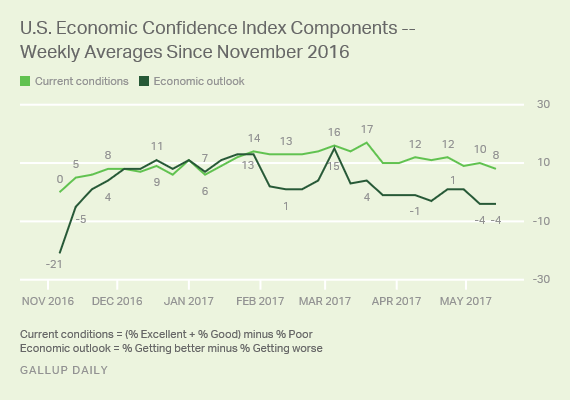
- Current conditions component at +8, economic outlook at -4
WASHINGTON, D.C. -- Americans' confidence in the economy has slipped over the past two months but remains higher than it was before the 2016 presidential election. Gallup's U.S. Economic Confidence Index averaged +2 for the week ending May 14 -- its lowest score recorded this year. This score is essentially unchanged from the +3 recorded the week before, but it is down considerably from the index's high point of +16 in early March as the stock market hit record highs.
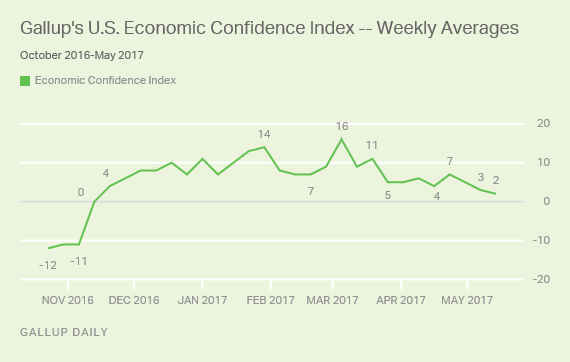
While Gallup's U.S. Economic Confidence Index has slumped since March, it has remained in positive territory -- something it rarely did from January 2008, when Gallup began tracking it daily, until early November 2016. In the last full week before the election, the index stood at -11. The week of the election, it rose 11 points to register a score of 0, and one week later, it rose again to +4. The most recent weekly average of +2 is the lowest score since the election occurred.
Gallup's U.S. Economic Confidence Index is the average of two components: how Americans rate current economic conditions and whether they believe the economy is improving or getting worse. The index has a theoretical maximum of +100 if all Americans were to say the economy is doing well and improving, and a theoretical minimum of -100 if all were to say the economy is doing poorly and getting worse.
For the week ending May 14, 31% of Americans assessed the economy as "excellent" or "good," while 23% said the economy was "poor." Overall, the current conditions component averaged +8 for the week, similar to +10 one week earlier but nine points below the record-high +17 set in mid-March.
But while Americans are generally optimistic about the current state of the economy, they continue to be pessimistic about the economy's future. Last week, 45% of U.S. adults said the economy was "getting better," while 49% said it was "getting worse," resulting in an economic outlook component of -4. Though unchanged from the week before, the outlook component has lost considerable ground since it peaked in early March at +15.
These data are available in Gallup Analytics.
Gallup.com reports results from these indexes in daily, weekly and monthly averages and in Gallup.com stories. Complete trend data are always available to view in the following charts:
Daily: Employment, Economic Confidence, Consumer Spending
Weekly: Employment, Economic Confidence, Job Creation, Consumer Spending
Read more about Gallup's economic measures.
View our economic release schedule.
Survey Methods
Results for this Gallup poll are based on telephone interviews conducted May 8-14, 2017, on the Gallup U.S. Daily survey, with a random sample of 3,538 adults, aged 18 and older, living in all 50 U.S. states and the District of Columbia. For results based on the total sample of national adults, the margin of sampling error is ±2 percentage points at the 95% confidence level. All reported margins of sampling error include computed design effects for weighting.
Each sample of national adults includes a minimum quota of 70% cellphone respondents and 30% landline respondents, with additional minimum quotas by time zone within region. Landline and cellular telephone numbers are selected using random-digit-dial methods.
Learn more about how the Gallup U.S. Daily works.