Story Highlights
- Index reading similar to prior two weeks' +3 ratings
- Index has remained within a two-point range since early May
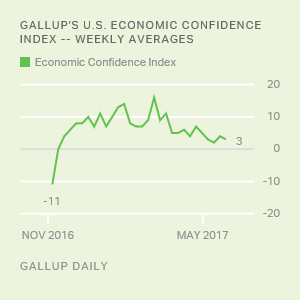
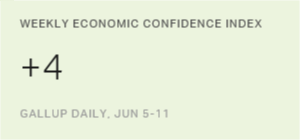
WASHINGTON, D.C. -- Americans' general perception of the U.S. economy remained slightly positive last week, with Gallup's U.S. Economic Confidence Index at +4 for the week ending June 11. This is on par with the index's narrow +2 to +4 range since the first week of May.
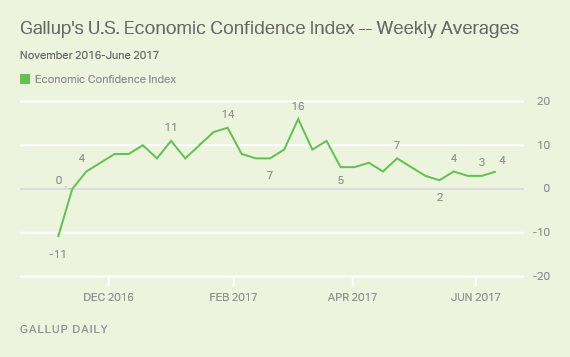
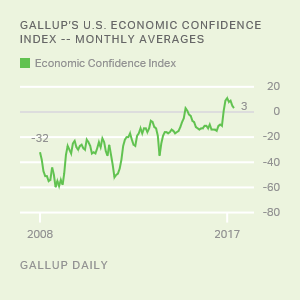
Americans' confidence in the economy is not as high as it was from December through March when the index reached +10 or higher at several points. This included a post-recession high of +16 for the week ending March 5.
But after a temporary stock market tumble in late March, the index fell to +5 and has since remained below +10. Still, from a long-term perspective, the recent confidence levels are well above the largely negative ratings Gallup recorded from 2008 through most of 2016.
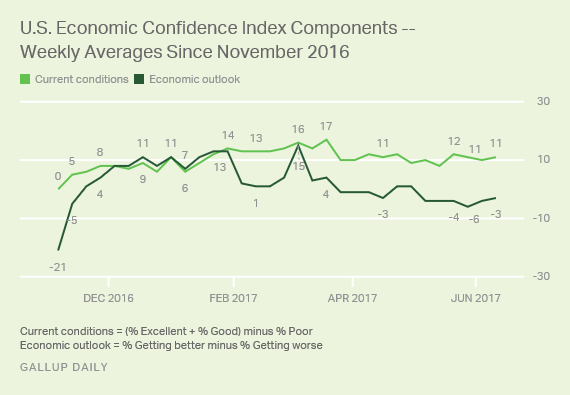
Gallup's U.S. Economic Confidence Index is the average of two components: how Americans rate current economic conditions and whether they feel the economy is improving or getting worse. The index has a theoretical maximum of +100 if all Americans were to say the economy is doing well and improving, and a theoretical minimum of -100 if all were to say the economy is doing poorly and getting worse.
For the week ending June 11, one in three Americans (33%) assessed the economy as "excellent" or "good," while 22% said it was "poor," resulting in a score of +11 for the current conditions component.
Meanwhile, Americans remain a bit more likely to say the economy is "getting worse" (49%) than to say it is "getting better" (46%), producing an economic outlook score of -3.
Bottom Line
Though Americans' views of the U.S. economy's health may not be as rosy as they were in the initial months after the presidential election, they remain positive overall -- a feat in its own right, considering how long the index spent in negative territory.
With the stock market remaining strong, the unemployment rate reaching a 16-year low and gas prices ebbing, Americans' perceptions of the country's economic health continue to show a marked improvement compared with previous years.
These data are available in Gallup Analytics.
Gallup.com reports results from these indexes in daily, weekly and monthly averages and in Gallup.com stories. Complete trend data are always available to view in the following charts:
Daily: Employment, Economic Confidence, Consumer Spending
Weekly: Employment, Economic Confidence, Job Creation, Consumer Spending
Read more about Gallup's economic measures.
View our economic release schedule.
Survey Methods
Results for this Gallup poll are based on telephone interviews conducted June 5-11, 2017, on the Gallup U.S. Daily survey, with a random sample of 3,561 adults, aged 18 and older, living in all 50 U.S. states and the District of Columbia. For results based on the total sample of national adults, the margin of sampling error is ±2 percentage points at the 95% confidence level. All reported margins of sampling error include computed design effects for weighting.
Each sample of national adults includes a minimum quota of 70% cellphone respondents and 30% landline respondents, with additional minimum quotas by time zone within region. Landline and cellular telephone numbers are selected using random-digit-dial methods.
Learn more about how the Gallup U.S. Daily works.