Story Highlights
- Percentage married to same-sex spouse up from 7.9% two years ago
- Sharp decline in same-sex domestic partnerships
- LGBT men more likely to be married than LGBT women
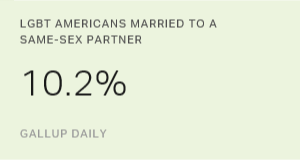
WASHINGTON, D.C. -- Two years after the Supreme Court ruled in Obergefell v. Hodges that states could not prohibit same-sex marriages, 10.2% of lesbian, gay, bisexual or transgender (LGBT) adults in the U.S. are married to a same-sex spouse. That is up from 7.9% in the months prior to the Supreme Court decision in 2015, but only marginally higher than the 9.6% measured in the first year after the ruling.
| Pre-Obergefell decision | Year 1, Post-Obergefell decision | Year 2, Post-Obergefell decision | |||||||||||||||||||||||||||||||||||||||||||||||||||||||||||||||||||||||||||||||||||||||||||||||||
|---|---|---|---|---|---|---|---|---|---|---|---|---|---|---|---|---|---|---|---|---|---|---|---|---|---|---|---|---|---|---|---|---|---|---|---|---|---|---|---|---|---|---|---|---|---|---|---|---|---|---|---|---|---|---|---|---|---|---|---|---|---|---|---|---|---|---|---|---|---|---|---|---|---|---|---|---|---|---|---|---|---|---|---|---|---|---|---|---|---|---|---|---|---|---|---|---|---|---|---|
| % | % | % | |||||||||||||||||||||||||||||||||||||||||||||||||||||||||||||||||||||||||||||||||||||||||||||||||
| Married to same-sex spouse | 7.9 | 9.6 | 10.2 | ||||||||||||||||||||||||||||||||||||||||||||||||||||||||||||||||||||||||||||||||||||||||||||||||
| Living with same-sex partner | 12.8 | 10.1 | 6.6 | ||||||||||||||||||||||||||||||||||||||||||||||||||||||||||||||||||||||||||||||||||||||||||||||||
| Single/Never married | 47.4 | 49.9 | 55.7 | ||||||||||||||||||||||||||||||||||||||||||||||||||||||||||||||||||||||||||||||||||||||||||||||||
| Living with opposite-sex partner | 4.8 | 5.0 | 4.2 | ||||||||||||||||||||||||||||||||||||||||||||||||||||||||||||||||||||||||||||||||||||||||||||||||
| Married to opposite-sex spouse | 14.2 | 13.6 | 13.1 | ||||||||||||||||||||||||||||||||||||||||||||||||||||||||||||||||||||||||||||||||||||||||||||||||
| Divorced | 7.1 | 6.4 | 5.4 | ||||||||||||||||||||||||||||||||||||||||||||||||||||||||||||||||||||||||||||||||||||||||||||||||
| Separated | 2.5 | 2.2 | 2.1 | ||||||||||||||||||||||||||||||||||||||||||||||||||||||||||||||||||||||||||||||||||||||||||||||||
| Widowed | 2.8 | 2.9 | 2.2 | ||||||||||||||||||||||||||||||||||||||||||||||||||||||||||||||||||||||||||||||||||||||||||||||||
| Sample size | 4,752 | 11,588 | 12,832 | ||||||||||||||||||||||||||||||||||||||||||||||||||||||||||||||||||||||||||||||||||||||||||||||||
| Dates: Pre-Obergefell (Jan. 28-June 26, 2015); Year 1, Post-Obergefell (June 27, 2015-June 19, 2016); Year 2, Post-Obergefell (June 20, 2016-June 19, 2017) | |||||||||||||||||||||||||||||||||||||||||||||||||||||||||||||||||||||||||||||||||||||||||||||||||||
| Gallup Daily | |||||||||||||||||||||||||||||||||||||||||||||||||||||||||||||||||||||||||||||||||||||||||||||||||||
On June 26, 2015, the Supreme Court issued the Obergefell decision. As would be expected, the number of same-sex marriages has increased, though the rate of increase has slowed.
As the percentage of LGBT adults in same-sex marriages has increased over the past two years, the percentage in same-sex domestic partnerships has fallen sharply from 12.8% before the Supreme Court ruling to 6.6%.
About half of the decline in same-sex domestic partnerships can be explained by the increase in same-sex marriages. The rest of the decline could mean that others formerly in same-sex domestic partnerships may have stopped living together, or no longer consider a same-sex cohabitant as a "partner."
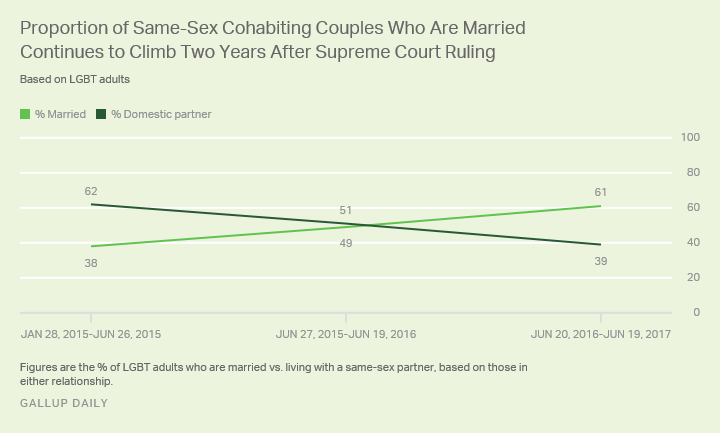
As a result of these shifts, Gallup estimates that 61% of same-sex, cohabiting couples in the U.S. are now married, up from 38% before the Supreme Court legalized same-sex marriage in June 2015, and 49% one year ago.
An increasing percentage of LGBT adults now identify their marital status as single or never married. That has always been the dominant status among LGBT individuals, but has increased from 47.4% to 55.7% over the last two years.
LGBT Americans are still more likely to be married to an opposite-sex spouse (13.1%) than a same-sex spouse (10.2%), but the gap is narrowing. According to prior research on LGBT identification, roughly half of those who self-identify as LGBT are bisexual, helping explaining the high proportion of LGBT individuals who are married to opposite-sex partners. Gallup's question does not probe specifically for whether LGBT individuals are lesbian or gay or bisexual or transgender.
The results are based on Gallup Daily tracking interviews since Jan. 28, 2015, when Gallup first asked lesbian, gay, bisexual or transgender (LGBT) individuals who indicated they were married or living with a partner if their spouse or partner was the same sex or the opposite sex.
Overall, 4.3% of U.S. adults identify as lesbian, gay, bisexual or transgender, according to Gallup's latest estimate from its June 2016-June 2017 tracking data. That is up from 3.9% a year ago and 3.4% in Gallup's initial estimate in 2012.
Same-Sex Marriage More Common Among Men, Older LGBT Adults
Currently, 11.4% of LGBT men versus 9.3% of LGBT women say they are married to a same-sex partner. Also, the marriage rate among older LGBT adults is higher than it is among younger adults.
| Men | Women | 18-29 years old | 30-49 years old | 50+ years old | |||||||||||||||||||||||||||||||||||||||||||||||||||||||||||||||||||||||||||||||||||||||||||||||
|---|---|---|---|---|---|---|---|---|---|---|---|---|---|---|---|---|---|---|---|---|---|---|---|---|---|---|---|---|---|---|---|---|---|---|---|---|---|---|---|---|---|---|---|---|---|---|---|---|---|---|---|---|---|---|---|---|---|---|---|---|---|---|---|---|---|---|---|---|---|---|---|---|---|---|---|---|---|---|---|---|---|---|---|---|---|---|---|---|---|---|---|---|---|---|---|---|---|---|---|
| % | % | % | % | % | |||||||||||||||||||||||||||||||||||||||||||||||||||||||||||||||||||||||||||||||||||||||||||||||
| Married to same-sex spouse | 11.4 | 9.3 | 3.3 | 14.4 | 18.1 | ||||||||||||||||||||||||||||||||||||||||||||||||||||||||||||||||||||||||||||||||||||||||||||||
| Living with same-sex partner | 7.4 | 6.0 | 3.8 | 8.9 | 8.9 | ||||||||||||||||||||||||||||||||||||||||||||||||||||||||||||||||||||||||||||||||||||||||||||||
| Single/Never married | 56.6 | 55.0 | 77.2 | 42.4 | 32.3 | ||||||||||||||||||||||||||||||||||||||||||||||||||||||||||||||||||||||||||||||||||||||||||||||
| Living with opposite-sex partner | 3.0 | 5.2 | 5.5 | 4.1 | 1.8 | ||||||||||||||||||||||||||||||||||||||||||||||||||||||||||||||||||||||||||||||||||||||||||||||
| Married to opposite-sex spouse | 13.2 | 13.1 | 6.2 | 18.4 | 19.3 | ||||||||||||||||||||||||||||||||||||||||||||||||||||||||||||||||||||||||||||||||||||||||||||||
| Divorced | 4.6 | 6.1 | 2.1 | 7.1 | 9.8 | ||||||||||||||||||||||||||||||||||||||||||||||||||||||||||||||||||||||||||||||||||||||||||||||
| Separated | 1.4 | 2.7 | 1.3 | 3.2 | 2.3 | ||||||||||||||||||||||||||||||||||||||||||||||||||||||||||||||||||||||||||||||||||||||||||||||
| Widowed | 2.0 | 2.4 | 0.5 | 0.9 | 7.1 | ||||||||||||||||||||||||||||||||||||||||||||||||||||||||||||||||||||||||||||||||||||||||||||||
| Sample size | 6,789 | 6,043 | 4,340 | 3,641 | 4,777 | ||||||||||||||||||||||||||||||||||||||||||||||||||||||||||||||||||||||||||||||||||||||||||||||
| June 20, 2016-June 19, 2017 | |||||||||||||||||||||||||||||||||||||||||||||||||||||||||||||||||||||||||||||||||||||||||||||||||||
| Gallup Daily | |||||||||||||||||||||||||||||||||||||||||||||||||||||||||||||||||||||||||||||||||||||||||||||||||||
Notably, even older LGBT adults are most likely to identify their marital status as single -- 32% say they have never married. This indicates that many LGBT adults, even at older ages when marriage may be more feasible or desirable than it is for younger adults, are remaining single. By comparison, 11.3% of non-LGBT adults age 50 and older have never married.
Implications
Same-sex marriages are becoming increasingly common, and same-sex domestic partnerships less common, for LGBT Americans. In the first year after the Supreme Court ruled states could not prohibit same-sex marriages, the percentage of LGBT Americans who were married grew nearly two percentage points. In the second year since the ruling, the growth has continued, but at a diminished rate. This suggests an initial burst in the number of same-sex marriages came in response to the legal changes. Now, with those legal changes further in the past, the growth in same-sex marriages may be slower.
However, growth in the rate of same-sex marriages is likely to continue. Younger adults, many who may not be in a position to marry regardless of their sexual identity, are disproportionately likely to identify as LGBT. As they age, their life situations may change and they may want to get married. Also, as future generations of LGBT adults come of age, having grown up in a time when there were no legal restrictions on same-sex marriage and greatly reduced societal norms against it, they may marry at higher rates than LGBT Americans in generations before them.
These data are available in Gallup Analytics.
Editor's Note: A correction was made to the estimated proportions of LGBT adults in cohabiting same-sex couples who are married (from 67% to 61%) or living with a partner (from 33% to 39%).
Survey Methods
Results for this Gallup poll are based on telephone interviews conducted June 20, 2016-June 19, 2017, on the Gallup U.S. Daily survey, with a random sample of 352,851 adults, aged 18 and older, living in all 50 U.S. states and the District of Columbia. For results based on the total sample of national adults, the margin of sampling error is ±1 percentage point at the 95% confidence level.
For results based on the total sample of 12,832 lesbian, gay, bisexual or transgender adults, the margin of sampling error is ±1 percentage point at the 95% confidence level. All reported margins of sampling error include computed design effects for weighting.
Each sample of national adults includes a minimum quota of 70% cellphone respondents and 30% landline respondents, with additional minimum quotas by time zone within region. Landline and cellular telephone numbers are selected using random-digit-dial methods.
Learn more about how the Gallup U.S. Daily works.