Story Highlights
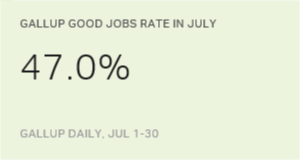
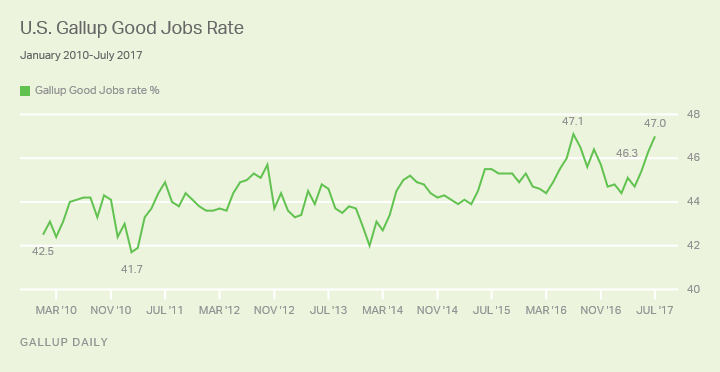
- GGJ rises to 47.0% in July, up from 46.3% in June
- Unemployment fell to 4.8% in July, a record low
- Underemployment also fell to 12.5%, another record low
WASHINGTON, D.C. -- The Gallup Good Jobs (GGJ) rate rose nearly a percentage point to 47.0% in July, from 46.3% in June. The GGJ rate now ties the highest point for the measure since 2010, 47.1% in July of last year.
The July figures are based on Gallup Daily tracking throughout the month, encompassing interviews with 28,383 U.S. adults.
The increase in the July GGJ rate is not unexpected, as the measure typically rises between the spring and summer months, peaking in June or July. The measure has risen each year, from the onset of spring in March to July, since Gallup began tracking the measure in 2010.
At 47.0%, the July GGJ rate is more than five percentage points higher than the all-time low for the measure, 41.7% in February 2011. That low point occurred as the economy was still recovering from the effects of the Great Recession.
The GGJ rate is the percentage of U.S. adults, aged 18 or older, who are employed on a full-time basis, at least 30 hours a week. Not included in the measure are individuals who are self-employed, work fewer than 30 hours a week, are unemployed or are out of the workforce. The GGJ metric reflects only those who are employed on a full-time basis for an employer and does not include measures of job satisfaction or compensation. The GGJ rate is not seasonally adjusted.
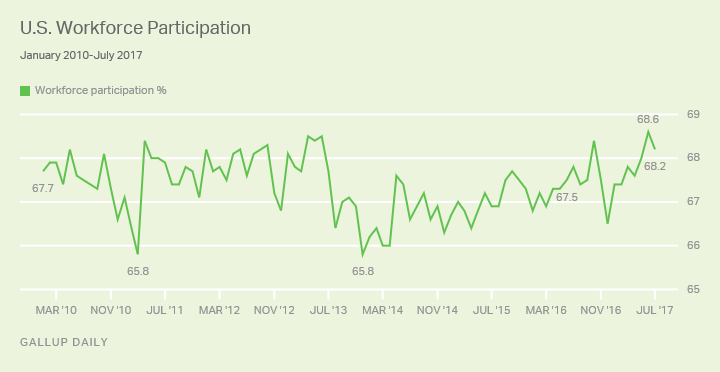
Workforce Participation Falls From Record High
Workforce participation fell slightly to 68.2% in July, from the record-high 68.6% in June. Gallup's measure of workforce participation includes all U.S. adults who participated in the workforce in any capacity, including those who worked full time or part time as well as those who were not working but actively sought and were available for work.
Unemployment Falls to Record Low
Gallup's unemployment rate in the U.S. fell slightly to 4.8% in July, from 5.2% in June. July's 4.8% is a new low, though effectively equivalent to last November's 4.9%. Additionally, the July rate is down slightly from the same month last year, when the unemployment rate was 5.1%.
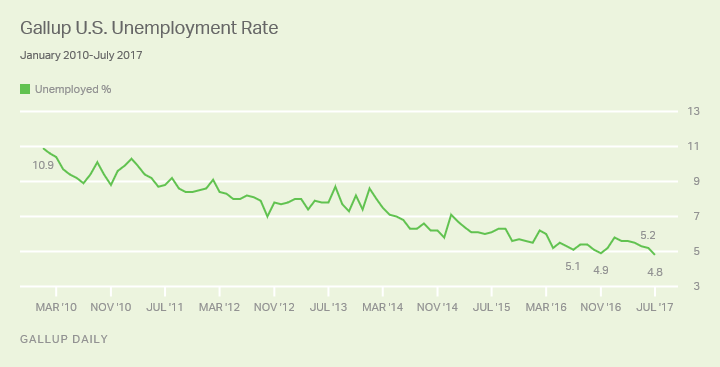
Unlike the GGJ rate, which indicates employment among the total population, both the Gallup and U.S. Bureau of Labor Statistics (BLS) unemployment rates are percentages of the labor force who are working or seeking work. While the Gallup and BLS measures are similar, there are methodological differences between the two. These differences are outlined at the end of this article.
Perhaps the most significant difference is that the BLS seasonally adjusts its most commonly used measure of unemployment, while Gallup does not. Although there is a strong correlation between the Gallup and BLS unemployment rates, the two trends do not always match on a monthly basis.
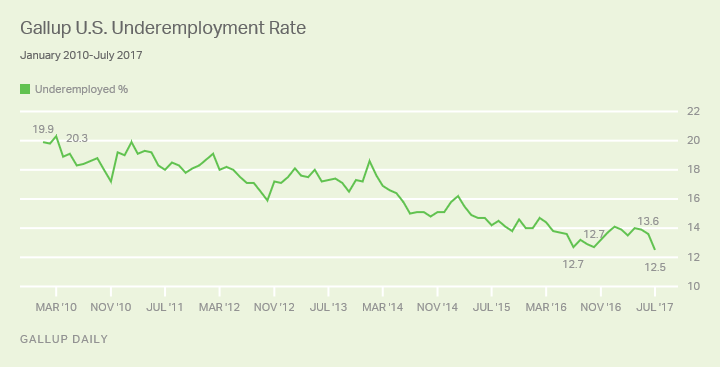
Underemployment Also Falls to Record Low
Gallup's measure of underemployment fell almost a percentage point to 12.5% in July, down from 13.6% in June. This rate effectively matches the prior record lows of 12.7% in July and October of last year.
Gallup's measure of underemployment is a combination of U.S. adults who are unemployed (4.8%) and those who are working part time but would like full-time work (7.7%).
Bottom Line
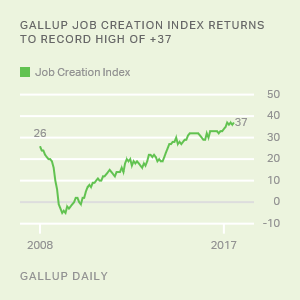
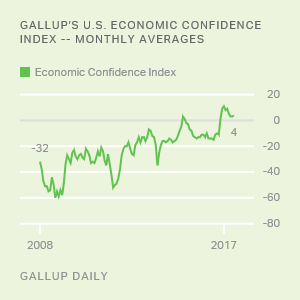
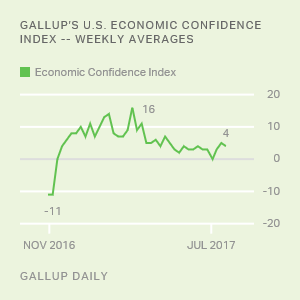
Three of Gallup's four measures of employment improved in July: the GGJ, unemployment and underemployment rates. Additionally, Gallup's Job Creation Index tied a record-high level and the Economic Confidence Index remained slightly positive throughout July.
The BLS reported that the economy added 222,000 jobs in June. Gallup's July employment data suggest that the jobs picture continued to improve in July, and that could be evident in the forthcoming BLS report.

Gallup Analytics
Subscribe to our online platform and access nearly a century of primary data.
| Most recent month (July 2017) | Previous month (June 2017) | Month a year ago (July 2016) | |||||||||||||||||||||||||||||||||||||||||||||||||||||||||||||||||||||||||||||||||||||||||||||||||
|---|---|---|---|---|---|---|---|---|---|---|---|---|---|---|---|---|---|---|---|---|---|---|---|---|---|---|---|---|---|---|---|---|---|---|---|---|---|---|---|---|---|---|---|---|---|---|---|---|---|---|---|---|---|---|---|---|---|---|---|---|---|---|---|---|---|---|---|---|---|---|---|---|---|---|---|---|---|---|---|---|---|---|---|---|---|---|---|---|---|---|---|---|---|---|---|---|---|---|---|
| % | % | % | |||||||||||||||||||||||||||||||||||||||||||||||||||||||||||||||||||||||||||||||||||||||||||||||||
| Employed full time for an employer (GGJ)* | 47.0 | 46.3 | 47.1 | ||||||||||||||||||||||||||||||||||||||||||||||||||||||||||||||||||||||||||||||||||||||||||||||||
| Employed full time for self* | 6.0 | 6.1 | 5.7 | ||||||||||||||||||||||||||||||||||||||||||||||||||||||||||||||||||||||||||||||||||||||||||||||||
| Workforce participation rate* | 68.2 | 68.6 | 67.8 | ||||||||||||||||||||||||||||||||||||||||||||||||||||||||||||||||||||||||||||||||||||||||||||||||
| Unemployment rate** | 4.8 | 5.2 | 5.1 | ||||||||||||||||||||||||||||||||||||||||||||||||||||||||||||||||||||||||||||||||||||||||||||||||
| Employed part time, wanting full time** | 7.7 | 8.4 | 7.6 | ||||||||||||||||||||||||||||||||||||||||||||||||||||||||||||||||||||||||||||||||||||||||||||||||
| Underemployment rate** | 12.5 | 13.6 | 12.7 | ||||||||||||||||||||||||||||||||||||||||||||||||||||||||||||||||||||||||||||||||||||||||||||||||
| *Metrics represent percentages of the population aged 18+ who have a job or are actively seeking work. **Metrics represent percentages of the workforce. | |||||||||||||||||||||||||||||||||||||||||||||||||||||||||||||||||||||||||||||||||||||||||||||||||||
| Gallup Daily | |||||||||||||||||||||||||||||||||||||||||||||||||||||||||||||||||||||||||||||||||||||||||||||||||||
| Gallup | U.S. Bureau of Labor Statistics | ||||||||||||||||||||||||||||||||||||||||||||||||||||||||||||||||||||||||||||||||||||||||||||||||||
|---|---|---|---|---|---|---|---|---|---|---|---|---|---|---|---|---|---|---|---|---|---|---|---|---|---|---|---|---|---|---|---|---|---|---|---|---|---|---|---|---|---|---|---|---|---|---|---|---|---|---|---|---|---|---|---|---|---|---|---|---|---|---|---|---|---|---|---|---|---|---|---|---|---|---|---|---|---|---|---|---|---|---|---|---|---|---|---|---|---|---|---|---|---|---|---|---|---|---|---|
| Population | 18 and older | 16 and older | |||||||||||||||||||||||||||||||||||||||||||||||||||||||||||||||||||||||||||||||||||||||||||||||||
| Adjustments | Not seasonally adjusted | Seasonally adjusted | |||||||||||||||||||||||||||||||||||||||||||||||||||||||||||||||||||||||||||||||||||||||||||||||||
| Sample size | 30,000 individuals per month | 60,000 households per month | |||||||||||||||||||||||||||||||||||||||||||||||||||||||||||||||||||||||||||||||||||||||||||||||||
| Mode of interview | RDD telephone, including cellphones | Rotating panel with face-to-face and telephone interviewing | |||||||||||||||||||||||||||||||||||||||||||||||||||||||||||||||||||||||||||||||||||||||||||||||||
| Data collection period | Continuous | One-week reference period occurring mid-month | |||||||||||||||||||||||||||||||||||||||||||||||||||||||||||||||||||||||||||||||||||||||||||||||||
| Reporting frequency | Daily, weekly, monthly, based on 30-day rolling averages | Monthly, based on one-week reference period | |||||||||||||||||||||||||||||||||||||||||||||||||||||||||||||||||||||||||||||||||||||||||||||||||
| Gallup | |||||||||||||||||||||||||||||||||||||||||||||||||||||||||||||||||||||||||||||||||||||||||||||||||||
Survey Methods
Results for this Gallup poll are based on telephone interviews conducted July 1-30, 2017, on the Gallup U.S. Daily survey, with a random sample of 28,383 adults, aged 18 and older, living in all 50 U.S. states and the District of Columbia. For results based on the total sample of national adults, the margin of sampling error is ±1 percentage point at the 95% confidence level. All reported margins of sampling error include computed design effects for weighting.
Each sample of national adults includes a minimum quota of 70% cellphone respondents and 30% landline respondents, with additional minimum quotas by time zone within region. Landline and cellular telephone numbers are selected using random-digit-dial methods.
Learn more about how Gallup Daily tracking works.